Wednesday, May 18, 2022

Finspiration Australia. Chart Analysis for Australian and International Stock Markets

Welcome to new reader from Russia.

19/5/22.  It was ugly on Wall Street last night. 


U.S. Indices.


Dow Jones -3.57%.  SP500 -4.04%.  Nasdaq -4.73%.  Small Caps -3.19%.  Banks -2.89%.

SP500.


Two Blue Supertrend lines and one Yellow.  (Two bears and one bull.). Until we see all yellow it's best to stay defensive.

Commodities.


No joy for traders in Commodities last night.

Commodities Index -2.16%.  Energy -2.19%.  Base Metals -2.04%.  Agriculture -2.44%.  Gold +0.05%.

Iron Ore -1.3%.  Thermal Coal -0.4%.

Overnight Oz Futures -1.9%.

Finspiration Australia. Chart Analysis of Australian and International Stock Markets.

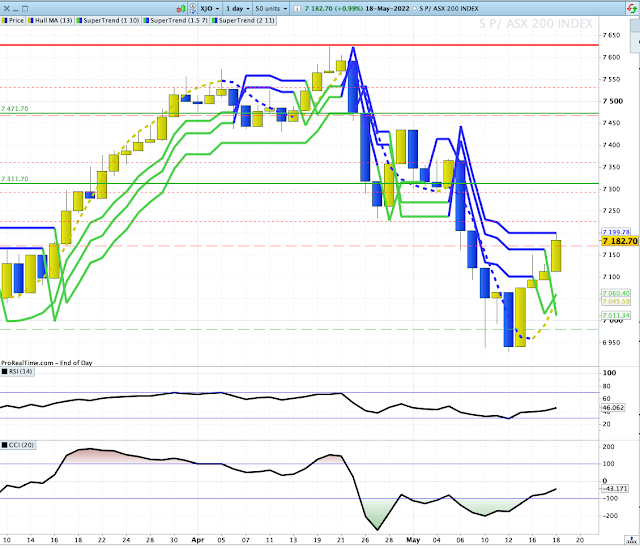
 18/5/22.  XJO up strongly today.


XJO up today +0.99%.  We now have four days to the upside.  XJO is now coming up to the last of three Super-trend lines.  That might provide some resistance.

In a return to form, Materials (XMJ +2.5%) was the top performing Sector.  Consumer Staples (XSJ -1%) was the worst performer and the only Sector to record negative figures.

Here's the XMJ Chart:


The correlation of XMJ and XJO is clear in this chart.  XMJ has risen above two Super-trend lines and approaching the third one.  That might cause a consolidation or pull-back.

I've calculated a turn-date of 26 May.  So we can expect more upside in the medium term, but not before we see some consolidation and then a move to the upside.

Below is a different type of chart suggesting that the current move is a counter-trend rally:


This chart shows the Ichimoku indicators.  

XJO has only just moved into the Ichimoku Cloud - that's a neutral or no-trade zone.

We need to see XJO get above the Ichimoku Cloud before being confident of a bullish medium-term trend. 


Tuesday, May 17, 2022

Finspiration Australia. Chart Analysis for Australian and International Stock Markets.

18/5/22.   Overnight.


Dow Jones +1.34%.  SP500 +2.02%.  Nasdaq +2.76%.  Small Caps +3.02%.  Banks +3.9%.

Euro Stoxx50 up +1.52%.

Despite the current rally, all of the above remain in a down-trend.  An up-trend can be declared when we see a higher high and a higher low.

SP500.


Two out of three Super-trend Lines have now switched to yellow (bullish).  Hull MA13 has switched to yellow (bullish).

Divergences on CCI are a leading indicator for a short-term trend change.  See Above.

Commodities.


Commodities Index -1.09%.  Energy -2.09%.  Base Metals +1.26%.  Agriculture +0.53%.  Gold -0.63%.

Iron Ore -0.7%.  Thermal Coal +2.8%.

Overnight Oz Futures +0.9%.

Overnight in the U.S., BHP up +3.25%, RIO +3.59%, Woodside +1.99%.

Finspiration Australia. Chart Analysis for Australian and International Stock Markets.

 17/5/22.  XJO up modestly today.


The first of three Supertrends has switched to bullish (yellow) and Hull MA13 has also switched from down to up (yellow=bullish).

Those are short-term signals suggesting that shorts should close out their positions at the end of trade.  Intrepid traders can go long.  I'd prefer to wait until we see all three Supertrends go yellow before taking a position.

Best sector today was Energy +2.09%.  The Ukraine War continues to dominate the Energy market.

In the short-term I remain bullish.  But this still looks like a "sell-the-rallies" market.

Monday, May 16, 2022

Finspiration Australia. Chart Analysis of Australian and International Stock Markets.

Overnight.  Energy up, Technology Down.

The American market was generally indecive with doji candle stocks evident on most important indices.


 Dow Jones flat +0.08%.  SP500 -0.39%.  Nasdaq -1.2%.  Small Caps -0.35%.  Banks -1.13%.

SP500.


Blind Freddy could see this chart is bearish.  It might be on the cusp of a counter-trend rally - but don't count on a lot.  Remember, the Fed is just around the corner waiting to mug the market.


Commodities.

Commodities Index +1.64%.  Energy +1.17%.  Base Metals +0.54%.  Agriculture Whooshka +2.98%.  Gold +0.95%.

Iron ore +1.2%.  Thermal Coal +2.5%

Those commodity price are looking good for our resource stocks today.

Overnight Oz Futures +0.3%.


Finspiration Australia. Chart Analysis of Australian and International Stock Markets.

 16/5/22.  Today in Australia.

XJO up modestly today +0.25%.


The day started positively but sold off intra-day - note the long upper-wick on today's candle.

After such a big up-day on Friday, some weakness today is not unexpected.  Friday's action still looks like a decisive short-term turning point for the XJO. 

Industrials (XNJ +2.42%) and Information Technology (XIJ +2.14%) were the stand-out sectors today.  XNJ was boosted by BNB +11.22% which was boosted by talk of a take-over.  XIJ is a barometer of risk-on sentiment, so its rise today is a good sign for the market.

I'm still expecting more upside in the short-term.

Saturday, May 14, 2022

Finspiration Australia. Chart Analysis of Australian and International Stock Markets

  Weekly Wrap - Week ending 13 May, 2022.

XJO Monthly Chart.


After two weeks of May, the monthly chart is in non-trending mode.  8-month EMA is trending down and this week, the XJO finished below the 8-MEMA.  Hull MA13 is trending up.  The Index is below the Supertrend (1.5/7).  Wait till the end of the month for clear long-term signal.

Weekly Chart.


XJO was negative this week, -1.81%, the fourth week down in a row.  

This chart is bearish.  Hull MA13 is blue (bearish); Supertrend (1.5/7) is blue (bearish) and the chart is below the 8-Week EMA which has turned down (bearish).  RSI and CCI are below their mid-lines (bearish) and Stochastic has fallen below its signal line (bearish).

That's a dreary outlook.

The chart shows a trading range in round figures from 7630 to 6930.  This week XJO finished at 7075.  

Daily Chart.


Friday was a serious up day for the XJO +1.93% .  It was a bullish engulfing candle, which coming at the low of a trend, is usually predictive of the end of the down-trend.

Thursday saw the Index at very oversold levels, with RSI below 30.  The Index duly delivered on Friday.

The short-term future of the XJO is looking positive.  XJO finished Friday at 7075.1  For a short-term trade, buy above 7077 with a stop loss at 7056.

Sector Changes - past week.


This chart shows the performance of each sector (plus Gold Miners, XJO, BEAR and IAF) over the past week.  

Health (XHJ +2.59%) sticks out like a sore thumb.  (Pardon the bad pun.). It was the only sector on the plus side.

Ten sectors were down.  Materials (XMJ -3.89%) was the worst.  Not long ago, XMJ was the mainstay of the XJO - not any longer.

XPJ (Property -2.55%) was hard hit again, but nothing like the previous week when it was down. -8.18%.  

Serious falls also occurred in the following sectors:  Information Technology -2.42%, and Industrials -2.22%

New Highs - New Lows Cumulative.

NH-NL Cumulative continues to fall and is now falling steeply under its 10-Day Moving Average, that's a big red danger sign for long-term investors.  


Below is a chart of % NH/NH+NL:


10-DMA of %NH/HN+NL is now the lowest it has been in the past 18 months.  As a contrarian indicator, that suggests we are near a low.


% of Stocks above key moving averages.

1.  % of stocks above 10-Day Moving Average, 20%.
2.  % of stocks above 50-Day Moving Average, 36%.
3.  % of stocks above 200-Day Moving Average, 33%.

All three are below 50% level - which confirms the bearish status of the ASX.

This is the second week in a row where %Stocks above 10-DMA has been 20% or below.

That's another contrarian signal for a short-term bounce.


Offence or Defence?


The above chart compares the performance of XSJ Consumer Staples (yellow and blue candles) with XDJ Consumer Discretionary (blue and grey candles).  

If consumers are confident about the economy, they are usually happy to splurge on big ticket, discretionary items - companies such as Harvey Norman, JB Hi-Fi and car retailers.  If consumers are not so confident about the economy, consumers tend to delay buying big ticket items.  

Consumer Staples are much more resilient to lack of confidence in the economy.  While they may delay purchasing a new refrigerator or Apple computer, consumers will still buy toilet paper and breakfast cereal.  In Australia, big retailers like Woolworths and Coles dominate the Consumer Staples market.

We can see in the above graph, that XDJ and XSJ were more or less in sync from May 2021 until February this year, when XSJ chart began to dominate the XDJ chart.  

That suggests that investors need to take on a more defensive posture than they had last year.

Note, however, the long lower tail on XDJ this past week.  The Index is attracting some buying power - so its fortunes may be change.

Conclusion.

1.  Weekly and daily charts are more or less in sync - bearish.  

2.  XSJ/XDJ suggests a defensive posture in investments.

3.  Contrarian indicators and support levels suggest the Australian market is at or close to a "bounce" level.  That will probably be a case of sell-the-rally. 

4.  Friday's good rebound may be a short-term game changer.  The intrepid can buy for a counter-trend rally.

Tips for the coming week.

Here are three beaten down stocks which, based on double divergences on MACD and MACD Histogram, are ready to make a rebound:  ALL, REH, JHX.  Do your own research on those stocks before buying.  You may have a different view.

ALL:  Buy at or above 33.06.  Stop Loss at 31.64.

REH:  Buy at or above 16.00.  Stop Loss at 15.02.

JHX:  Buy at or above 40.64.  Stop Loss at 39.06

Good Luck for the coming week.

Finspiration Australia. 14/11/23. Tues. Morning Report.

Mixed Results in New York.  Energy up. NAB ex-dividend today. Dow Jones +0.16%.  SP500 -0.08%.  Nasdaq -0.11%.  Small Caps -0.07%.  Banks -0...