Showing posts with label XEJ. Show all posts

Wednesday, April 5, 2023

Finspiration Australia.

 5/4/23.  Australian market finishes flat today.


XJO finished just up today, +0.02%.

Today's candle is a doji which is often an ominous signal coming at the top of an up-trend.

Today was the eighth day to the upside.  That's getting a bit old for a short-term up-trend.  Of course, it can go higher, but the probabilities now lie to the downside.

Despite the marginal upside finish, breadth was good with nine out of eleven sectors finishing in positive territory.

Negative sectors today were in the resources:  XMJ (Materials) -0.6% and XEJ (Energy) -0.6%.

Amongst the large cap stocks today, BHP -1.5% and Rio -0.9% were the worst performers.

Best performer was Telecommunications +0.8%.  Three sectors recorded rises of +0.7%: XIJ, XNJ and XHJ.  Those three sectors are now sitting at strong overhead resistance - adding weight to the idea that we may see a pull-back.


Tuesday, April 4, 2023

Finspiration Australia.

 4/4/23.  Tuesday Evening Finspiration Report.

Reserve Bank Interest Rate Day - A Fizzer?


XJO finished higher today - up just +0.18%.

Interest Rate Day often produces some sharp movements in the market - but not today.  After the "No Change" announcement, XJO did move higher but not much, up 14 points or +0.19%.  That's not a lot compared to what it can do on IRD.

Notice how the XJO moved up in the five minutes before the interest rate announcement.  Somebody (or somebodies) seems to have pre-empted the IR announcement.  I suspect it occurred while there was some unseen selling going on in the background - two bob each way.  If it goes down, the punter/s exits the buy side and let the sell side cascade down.  If it goes up - exit the sell side and enjoy the ride.  Remember that HFT Algorithms react in a milli-second, and large institutions act within one second.  No retail trader can hope to compete in these sudden changes in direction.

Nine out of eleven sectors were up today.  A big hit was taken by XMJ (Materials), down -0.9%.  BHP, the largest stock in that sector, was down -2.2% today.

Best sector was Energy, up +1.3%.  It got a push higher from oil price rises overnight - as a result of cuts by OPEC to their output.

Here's the XMJ Chart:

XMJ finished the day below the Short-Term Line (3-DEMA) but remains above the 8DEMA (dashed line).  A finish below that would be short-term bearish.


Friday, March 24, 2023

Finspiration Australia.

 25/3/23.  Saturday Finspiration Report.

Yesterday - XJO down marginally after strong intra-day buying.

Last night - U.S. stocks finish positive.

XJO Friday:

XJO down -0.2% yesterday.  The long lower wick on yesterday's candle indicates strong intra-day buying.

The only positive on the chart is the Hull MA13 which is the shortest MA I use.  

XJO remains below the 200-Day MA.  It has been rejected by the 10-Day MA and the first line of the triple Supertrends.  We need to see better than that to enter for a trade.

Overnight in the U.S.  Major indices finish up modestly.  Regional Banks have a big rise.


Dow Jones +0.41%.  SP500 +0.56%.  Nasdaq +0.31%.  Small Caps +1.07%.  Regional Banks +3.03%.  Despite that big rise in Region Banks, the chart remains mired at the low end of its big down-trend.

SP500.


SP500 is doing better than Australia's XJO.  It finished last night above its 200-Day MA and above all three of the triple Supertrends.  

Hull MA13 is positive and the Index finished above the 10-Day MA.

The index remains locked between the 50-Day MA and the 200-Day MA.  A move above the 50-Day MA would be bullish.

Commodities.


Commodities Index +0.48%.  Energy +0.2%.  Base Metals flat -0.05%.  Agriculture +1.53%.  Gold -1.13%.

The upside movements in the American Indices suggest that the Australian market will be up on Monday.

Bitcoin.


Overnight, Bitcoin was down -2.41%.  The Hull MA13 has turned down which is a short-term negative signal.

Longer term, BTC remains bullish - above the 10-Day MA and triple Supertrends.


Saturday, February 11, 2023

Finspiration Australia

   12/2/23.  Weekend Report - The Week That Was.  Week Ended 10/2/23.

This week has seen a dramatic change in investor sentiment.  The previous week, the market was all gung-ho and seriously overbought.  This week, investors sobered up and a pull-back has started.

XJO Monthly Chart.


We've only had ten days so far in February.  XJO down so far -0.58% stalling at the top of the strong January candle.  XJO has also reached a zone where it has failed in the past.

So far, the Index is above the 10-MMA, Hull MA13, 50-MMA, 200MMA, Supertrend (7/1.5).  Not much damage done yet.
  
Monthly RSI is at 56.57.  50 represents the dividing line between bullish and bearish.

XJO Weekly Chart.


In the past five days, XJO fallen -1.65%.  

The weekly chart shows a bearish engulfing candle.  That's occurred at a major resistance zone.

Candlesticks are a graphic depiction of buying and selling in the market.  A big dark engulfing candle shows the sellers were in complete control of trading this week.

8-Week EMA, Hull MA13 and Supertrend remain in bullish configurations, so not a lot of damage done yet.

Weekly RSI is at 60.58 - bullish but falling.  

Stochastic was showing a negative divergence and has now turned down below its signal line.


XJO Daily Chart.


XJO was in a strong up-trend in January.  That's all changed now.

Daily RSI is now at 53.71 - that's well below the weekly RSI of 60.58.  A fall by the Daily RSI below the Weekly RSI is indicative of a pull-back.  That's not something to trade from - but a filter to alert you to look at the charts and trade the charts.

Daily RSI remains above the bullish level of 50.

The indicator overlays on the chart (8-DEMA, Hull MA and Supertrend) all indicate the dramatic nature of the reversal that's occurred in the XJO.

STW Daily.

XJO can be a bit deceptive on a chart as it always opens at the same level as the previous day's close.  Never any gaps on an XJO chart.

STW is a tracking ETF for the XJO and can often give clues as to investors' thinking not available from the index.

The above chart shows a big gap opening to the down-side on Friday and breaking below key indicators (8-DEMA, Hull MA and Supertrend).  That's a key sign that a trend reversal has occurred.

Of course, the market always tries to play with the minds of investors.  Looking at the right hand side of the chart, an investor might think that further downside is immediately probable.  But looking at the left hand side of the chart shows a key support at 67.08.  STW closed at 67.07 on Friday - so we might get some upside here before another move to the downside.  

Monthly, Weekly and Daily RSIs. - Sectors + XJO + Gold + Composite Bonds.


This week's chart:


In the week prior to this now, five sectors out of eleven were 70 RSI.  Now there are none, with only one sector above 60 - XXJ - but it is also in pull-back mode.   

Bullish sectors with RSIs arranged in ascending order are:  XDJ, XIJ, XSJ.  In the previous week, eight sectors were bullish.  That's a big change in breadth.

Sectors in pull-back mode (Daily RSI falling below Weekly RSI) XXJ, XMJ, XEJ, XTJ, XHJ, XUJ, XPJ and XNJ.  That's eight out of eleven sectors.

Gold (an industry group within XMJ) is in pull-back mode. 

On the daily time-frame, we've switched from eight out of eleven bullish sectors, to eight out of eleven sectors in pull-back mode.


NewHighs-NewLows Cumulative.

This is a long-term lagging indicator, but a good guide for long-term investors.


NH-NL Cum is represented by the blue line.  It is now marginally above the 10-DAY MA but remains well above the 21 and 34 Day Moving Averages.  The Moving Averages are all aligned in bullish fashion from 10DMA at the top, then 21, then 31.  This provides a buffer against pull-backs.

I've developed another long-term metric "StrongStocks-WeakStocks" which is similar to NH-NL but gives signals a little earlier than NH-NL  SS-WS is up for the 13th week in a row and has moved well above its 5-Week MA.   This week there were only 6 Strong Stocks compared to 34 the previous week.  Weak stocks remained at four.   While this remains above its 5-Week MA, long-term investors can remain calm.


% of Stocks above key moving averages.

1.  % of stocks above 10-Day Moving Average: Last Week 67%, This Week 26%.  
2.  % of stocks above 50-Day Moving Average, Last Week 78%, This Week 61%.  
3.  % of stocks above 200-Day Moving Average, Last Week 76%, This Week 71%.  

All metrics have pulled back, but only the shortest time-frame one is showing bearish tendencies.  At this stage, we are seeing a pull-back and nothing more serious.


Stocks above 200-Day MA have fallen from 76% to 71% but remain above the 5-Week MA.


Conclusion.
 
Daily chart of XJO was in a strong uptrend.  That has now reversed to the downside.

STW (ETF for XJO) suggests we could see some consolidation here or some upside in the near term.  

Overall, however, investors' mind-set has now taken a turn for the worse.  Expect more downside before this pull-back is over.


Tuesday, October 18, 2022

Finspiration Australia. Chart Analysis for Australian and International Stock Markets. + Bitcoin.

 19/10/22.  Overnight in America:  Indices up, but suffered intra-day reversal.

Dow Jones +1.12%.  SP500 +1.14%.  Nasdaq +0.9%.  Small Caps +1/16%.  Banks +1.04%.

Nasdaq was up +2.7% in early trade but finished up +0.9%.  That gives some idea of the magnitude of the reversal today.  Not pretty.

SP500.

SP500 had a strong gap-up open but reversed to give up some of the early gains.

The Index is now well above the Andrew's Pitchfork which is promising for the bulls, but now faces resistance from the Base Line of the Ichimoku system.  Expect some consolidation or small pull-back.

The Index remains in a down-trend (lower highs and lower lows) but the jump above the Pitchfork suggests that this down-trend is reversing to the upside, but it could be a long hard slog.

Commodities.

Commodities Index -1.08%.  Energy -1.67%.  Base Metals -0.73%.  Agriculture -0.15%.  Gold +0.22%.

This morning ASX futures were down -0.4% suggesting a weak opening.  But, after 90 minutes of trading, XJO is up +0.3%.

Bitcoin.

Bitcoin continues to languish in its sideways consolidation.  It remains below the Kumo Cloud and facing resistance of the Base Line which has held advances since late August.

The Kumo Cloud is becoming quite thin, which suggests that resistance would be easy to over come if a solid advance does occur.  Wait.

Saturday, October 15, 2022

Finspiration Australia. Chart Analysis for Australian and International Stock Markets.

Weekly Wrap, Week ended 14 October, 2022.  Is the Bear finished?

XJO Monthly Chart.


This chart is almost identical to the one shown last week.  XJO made a good start to the month, but this is only Week One of October.  Week Two has been flat.  The chart remains in a down trend.

XJO Weekly Chart.


This week's candle is a "dragonfly doji" - which means the XJO finished almost where it started after having a big dip down during the week.  XJO finished down just -0.06%, essentially flat.

This week's candle remains marginally above the 8-Week EMA.  One of the two Supertrend lines has switched from blue (bearish) to yellow (bullish).  That suggests the XJO is in non-trending mode.  Hull MA13 remains headed down.  This chart is more bearish than bullish. has run into the resistance of the other Supertrend lines.

XJO has, however, bounced off horizontal support - so it may be headed higher to again test the 50-Week MA as resistance.

XJO Daily Chart.


XJO was down strongly on Monday, waffled around on Tue-Thur, then surged higher on Friday.  

The Index remains within the confines of the descending broadening wedge shown on the chart.  A break to the upside of that wedge would be bullish, but then it faces the resistance of the 200-Day MA.  As a general rule, it is best not to enter long-term positions while the chart is below the 200-Day MA.

This week saw the XJO test the 50% retracement of the previous rally, and then bounced.  That could be the start of another test of the oblique restraining line of the descending wedge.  A break above that should see the continuation of the counter trend rally

Action on Friday raises the possibility that Tue-Thur is a higher low.  We need to see a higher high to call this a bull rally, i.e., XJO must rise above 4 October.

SP500 Daily.


This is a fascinating study in chart analysis.  From the high in August, the chart has made lower highs and lower lows - the definition of a down trend.  The lower highs have all occurred after counter-trend rallies up to the descending 20-Day MA.  Each time, the chart has declined to form a lower low.

Momentum is slowing as shown by the MACD Histogram.  It shows a positive divergence from the chart.  This suggests the possibility of a trend change.

Thursday saw one of the biggest reversal days on the SP500 for the past 50 years.  That produced a lot of euphoria - to be dampened by a big down day on Friday.  Volatility like this often occurs at the end of trends as the bulls/bears battle for supremacy.

It will mean down day on the XJO on Monday.

ASX Sector Results for this week.


Three out of eleven sectors were up this week, two of those (Consumer Staples and Consumer Discretionary) were only up marginally.  XJO finished flat for the week, but it was largely the good performance of Financials (XXJ) which kept the XJO more or less on an even keel.  XXJ up +3.61%.   

Relative Strength of Sectors.

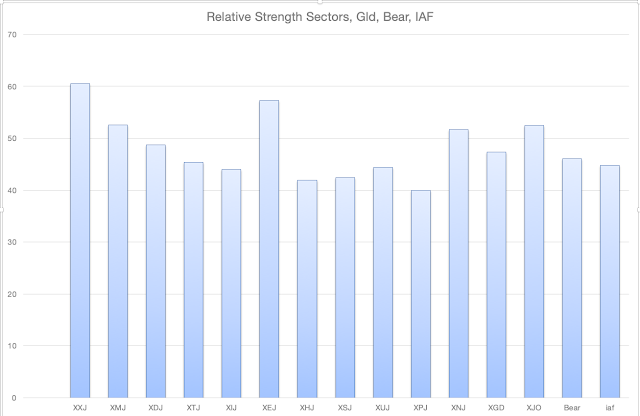
RSI (Relative Strength Index) is calculated using the default setting of 14 days - almost three weeks of trading.  It provides a more reliable guide to changes in sectors than the one-week results which can jerk around quite a lot and, thus, RSI is probably a more reliable guide to recent strength in the sectors. (Click here for a description of RSI.)


Four sectors out of eleven are above 50:  Financials (XXJ), Materials (XMJ), Energy (XEJ) and Industrials (XNJ).  That's the same as the previous week.  Leadership has now shifted from Energy to Financials.  Energy and Materials were weak this week, but a return to the upside should lead to an improvement in the XJO as a whole.

NewHighs-NewLows Cumulative.


This is a metric for the long-term investor.  While NH-NL Cumulative remains below its 10-Day Moving Average, it is best for long term investors to remain cautious and defensive regarding the market.

% of Stocks above key moving averages.

1.  % of stocks above 10-Day Moving Average: Last Week 76%, This Week 54%.  
2.  % of stocks above 50-Day Moving Average, Last Week 26%, This Week 27%.  This remains bearish.
3.  % of stocks above 200-Day Moving Average, Last Week 21%, This Week 29%.  That's an improvement but still bearish.


The long term metric (% Stocks below 200-Day MA) remains very bearish but above its 5-Week MA.  That's promising. I'd like to see this above at least 40% before feeling comfortable.

Conclusion.
 
Overall, our market remains bearish, but we may be seeing a nascent counter-trend rally.

Remember that bear markets tend to reverse quickly.  Just because the market is bearish doesn't mean it can't change to the upside in the blink of an eye.  The stock market tends to be forward thinking - and can reverse when everything looks bleak.  While the Federal Reserve keeps chanting their mantra of higher rates, that is capturing the thinking of many investors.  Irristible forces in the stock market might have other ideas.

I'll leave you with the same thought I gave you last week.

Interestingly, the stock market in 2022 has generally followed the downward path typical for a midterm election year since 1962, according to Dan Clifton at Strategas. The S&P 500 is down slightly more than the typical 19% intra-year decline, but the news improves if stocks stick to the script. Stocks have historically bottomed in October and rallied by an average of almost 32% in the next twelve months. Clifton notes that stocks have been positive in the year after every midterm election since 1942!

Stay Safe.


Thursday, September 8, 2022

Finspiration Australia. Chart Analysis for Australian and International Stock Markets.

8/9/22.  XJO up strongly today.


XJO up today +1.77%, completely erasing the previous day's big fall.

The Index has plenty of overhead resistance which will be problematic for the Index.

After such a big surge today, expect tomorrow will be a narrow range day.  

Until the Index gets above the 200-Day MA (big black line) the long term trend remains in doubt.

Breadth was good today with ten out of eleven sectors on the upside.  The only negative sector was XEJ down -2.8%.  It had to contend with dual head-winds.  The biggest stock in XEJ is Woodside which went ex-dividend today.  Overnight, Energy was well down, so that was another drag on XEJ today.

Currently in overseas trade, US futures are sluggish.

Our market can expect a narrow range, indecisive day tomorrow.


Tuesday, July 12, 2022

Finspiration Australia. Chart Analysis of Australian and International Stock Markets

 12/7/22.  Australian market finished flat today.  XJO +0.06%.


ASX started strongly this morning, up +0.7%, but turned down at 10.25 a.m. and never really looked likely to return to its bullish opening.

The Index remains in a short-term sideways consolidation.  The three supertrend lines are flat and parallel to each other.  Two lines are above price and one below - another indication of an indecisive market.  Wait.

One of the major reasons for the reversal was the Energy sector.  It was up nearly +1% in early trading but fell away to finish up just +0.17%.

Amongst large cap stocks, the three best were Amcor +2.38%,  Resmed +2.08% and Woolworths +2.03%.  Two of those stocks (RMD and WOW) were in the small group in the Weekly Wrap to watch.

Thursday, June 16, 2022

Finspiration Australia. Chart Analysis of Australian and International Stock Markets.

 16/6/22.  XJO finished flat today -0.15% after being up >1% in early trading.


Today was a reversal day - that's not uncommon as an Index searches for a "bottom".  Such action at the top of a trend is negative - at the bottom of a trend it suggests the opposite.

RSI14 is very oversold at 25.03.  We don't often see readings like that without a short-term rebound.

Breadth today was OK with 898 Advancing Issues and 583 Declining Issues.

Four Sectors were up today Energy +0.48%.  Materials +0.38%.  Communication Services +0.53%, and surprisingly, Property +1.2% (the best performing Sector).

GMG is the largest stock in the Property Sector.  It was up today +2.39%.


Positive Divergences, particularly on MFI, suggest the next move will be to the upside.  Watch.

Thursday, June 9, 2022

Finspiration Australia. Chart Analysis of Australian and International Stock Markets.

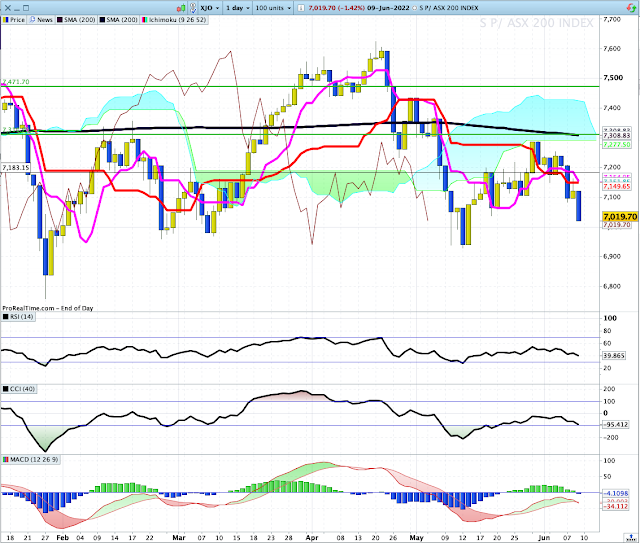
 9/6/22.  XJO fell heavily again today.


XJO fell today -1.42%.  Financials (XXJ -2.07%) again smashed.


XXJ has now lost all of the big rally from early March to late April.  I'll be looking for a floor under XXJ about these levels.

Best performing sector today was Energy +0.56%.  It was the only sector with a positive result.

Breadth remains poor.


NewHighs-NewLows Line continues to fall steeply.  The Advances-Declines Line confirms the bearish outlook.


I think it is best to stay defensive until we see definite improvement in these instruments.


Finspiration Australia. 14/11/23. Tues. Morning Report.

Mixed Results in New York.  Energy up. NAB ex-dividend today. Dow Jones +0.16%.  SP500 -0.08%.  Nasdaq -0.11%.  Small Caps -0.07%.  Banks -0...