18/6/22. Yesterday in Australia.
Yesterday, the ASX200 (XJO) was down -1.8%.
Below is the chart for STW - ETF for the ASX200. I've chosen the STW chart today rather than the XJO chart because STW chart is somewhat more realistic in showing the market than the XJO. XJO always starts where the previous day leaves off - so it is always continuous. STW opens either up or down from the previous day's close. Those gaps are often small, or, as in recent days quite large. It also allows us to see more clearly the intra-day action in the market.
Friday's candle shows an opening gap down of >2%. It then fell more (long lower wick) then recovered somewhat to finish above its opening quote. So we did see some intra-day buying, which didn't occur on Thursday when the candle was basically all blue, i.e., it fell from its opening quote and didn't recover.
I've also shown on this chart the clear Head/n/Shoulders pattern which formed from late February into early June, with the Head forming in early April.
The fall from the Head to the Base Line is >8%. The fall from the Base Line to the low of yesterday's candle is ~7%. So, if the Standard Measure Rule (SMR) is followed, STW still has about -1% to fall before we get a rebound. SMR is never 100% accurate, but provides a guide to investors watching for a Point of Interest, give or take a bit, where a rebound might occur.
Are we there yet? Maybe, start looking for a rebound now. Any rebound will, however, probably be a counter-trend rally while Central Banks around the world continue to turn the interest rate screws to counter inflation.
Overnight.
Dow Jones flat -0.13%. SP500 +0.22%. Nasdaq +1.43%. Small Caps +0.7%. Banks +0.88%.
Yesterday in America was Options Expiry Day, which leads to much higher volumes.
SP500.
SP500 is now down -24.5% since its high in early January.
The Options Expiry Week shows a statistical bias to the positive side. It certainly didn't happen this week with the SP500 down -6%. Bear Markets ruin every edge that statistics provide to the trader.
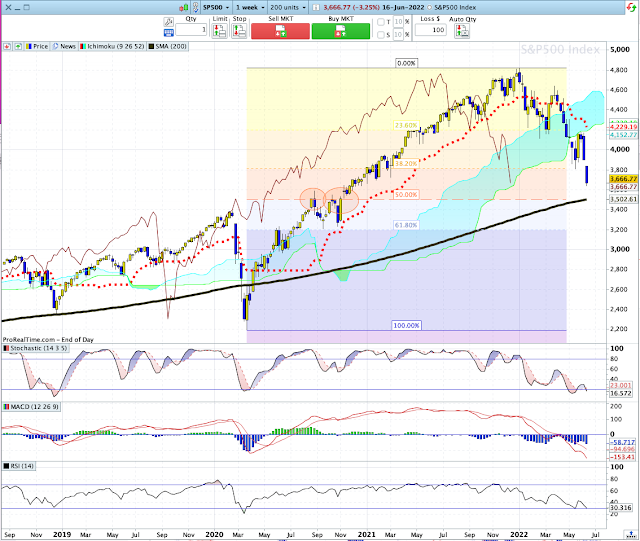
Here's a weekly chart for SP500:
This chart provides clues to a possible "bottom" in this bear market.
The 50% retracement level is shown from the bear market low of March 2020 to the high of the rally in early January 2022. That level is at 3502.6. SP500 finished Friday at 3666.8
The 50% retracement level more or less coincides with the 200-Week Moving Average and horizontal support/resistance from August-November 2020.
So, we have triple alliances occurring around the 50% retracement level. That's powerful stuff.
I've also calculated a turn date (using Gann measure principles) of 26 June, give or take a couple of days. Another week of down time would bring the SP500 down to about that triple alliance.
Look for a rebound around that level, i.e., in round numbers 3500.
Good luck.


