9/4/23. Weekend Report - The Week That Was. Week Ended 6/3523.
XJO Monthly Chart.

We've had only one week so far in April. XJO is up, so far, +0.57% and remains within the range of the month of March.
The three Supertrend lines are showing a non-trending long term index, one Supertrend line above the chart and two Supertrend lines below the chart. All three Suprertrend lines are horizontal - indicative of a sideways trend.
PPO is above 0 - that suggests a bullish trend. It's been that way since Dec. 2020.
DZ Stochastic is above its buy line, but turned down - indecisive.
Schaff Trend Cycle is just below its "buy" line. It wouldn't take much to turn that bullish.
This is only at the beginning of the month, so no decisions made on this chart.
XJO Weekly Chart.

DZ Stochastic has turned up but hasn't crossed above its "buy" line. Schaff Trend Cycle remains under its "do not buy" line.
PPO is marginally above its zero line. We need to see it turn up from there to be confident of a new bullish trend.
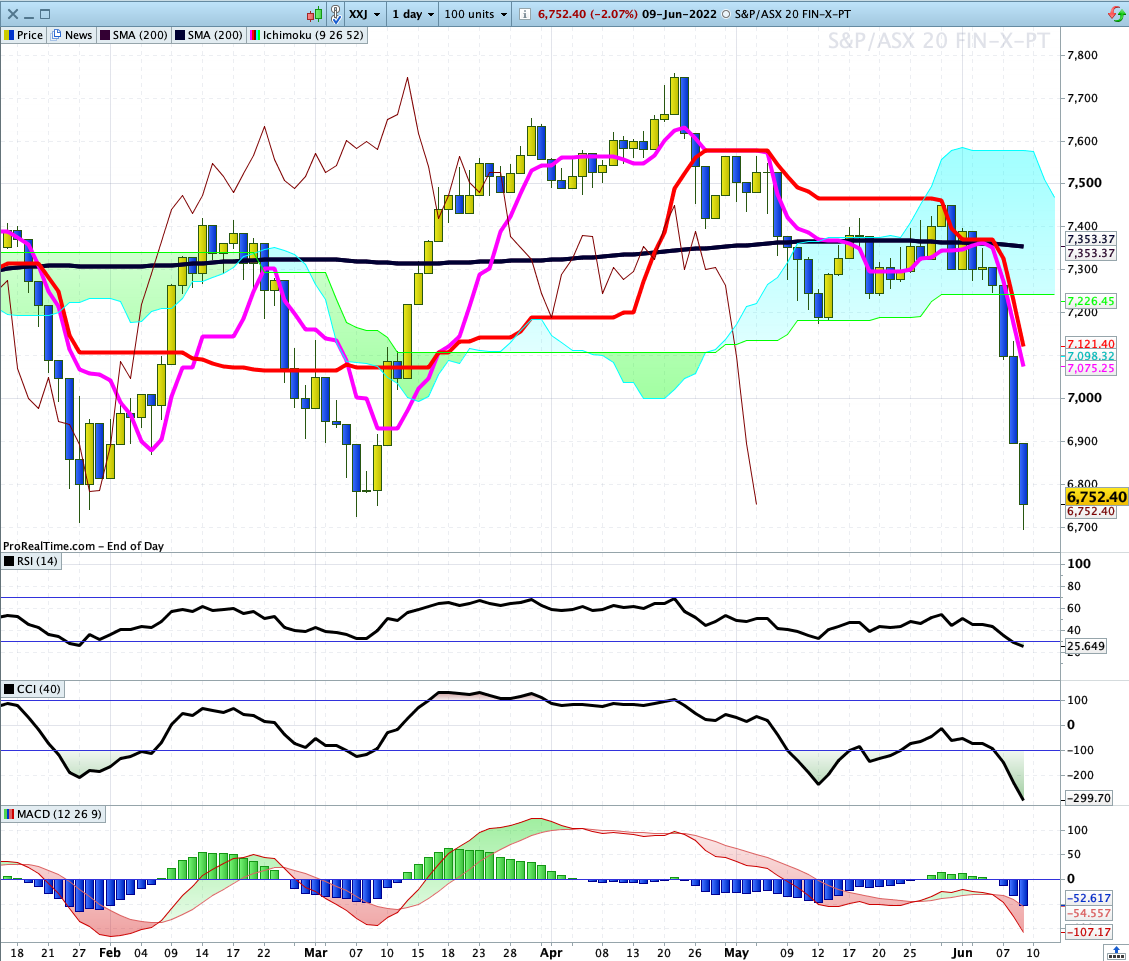
XJO Daily Chart.

XJO was up +0.57% this week.
XJO was up eight days in a row until the negative day on Thursday. That's an unusually strong short-term rally, and it appears to be faltering with three narrow-range doji candlesticks in a row. That's occurring at a support-resistance line at 7226. XJO finished the week at 7219 - marginally below horizontal resistance.
That Horizontal Resistance Line also coincides with the 50% retracement of the fall from early Feb. to late March. Reversal of trends often occur at the 50% level.
DZ Stochastic has turned down but remains above its "sell" line. Schaff Trend Cycle also remains above its "sell" line. PPO is marginally above its zero line.
All that suggests that the coming week could be crucial to the future of the XJO.
Weekly Changes in Sectors.

XMJ (Materials) was the dog in the major this week. (Not quite an appropriate metaphor in the Easter Week).
XMJ was the only negative sector - down -2,72%,
Defensive Sectors were fairly strong this week: XHJ +3.83%, XSJ +1.78%, XUJ + 1.78%, XTJ +1.68%.
That suggests we've seen a rotation into defense against the usually strong XMJ. It should be kept in mind that XMJ was up +7.01% in the previous week. So it's not surprising that it had a fall this week.
Sector Momentum.

All three columns sloping up - bullish trend. XDJ, XIJ, XTJ, XHJ, XSJ, XNJ, XGD, IAF.
All three columns sloping down - bearish trend. XMJ, XPJ
Down then up - counter trend bullish rally. XXJ, XEJ, XUJ.
Up then down - counter trend bearish rally. No sectors.
Some sectors were affected this week, XHJ moved into the bullish section. Materials moved from "bullish counter trend rally" to "bearish". Again - this emphasises the shift into defense from offence.
Gold Miners and Composite Bonds (IAF) are bullish - both of those tend to be safe havens.
XJO remains in a "counter trend rally"
NewHighs-NewLows.

NH-NL Cumulative started falling on 9 Feb. This week it moved back above its 10-Day MA. That's a promising sign for long-term investors.
Stocks/Bonds Ratio.
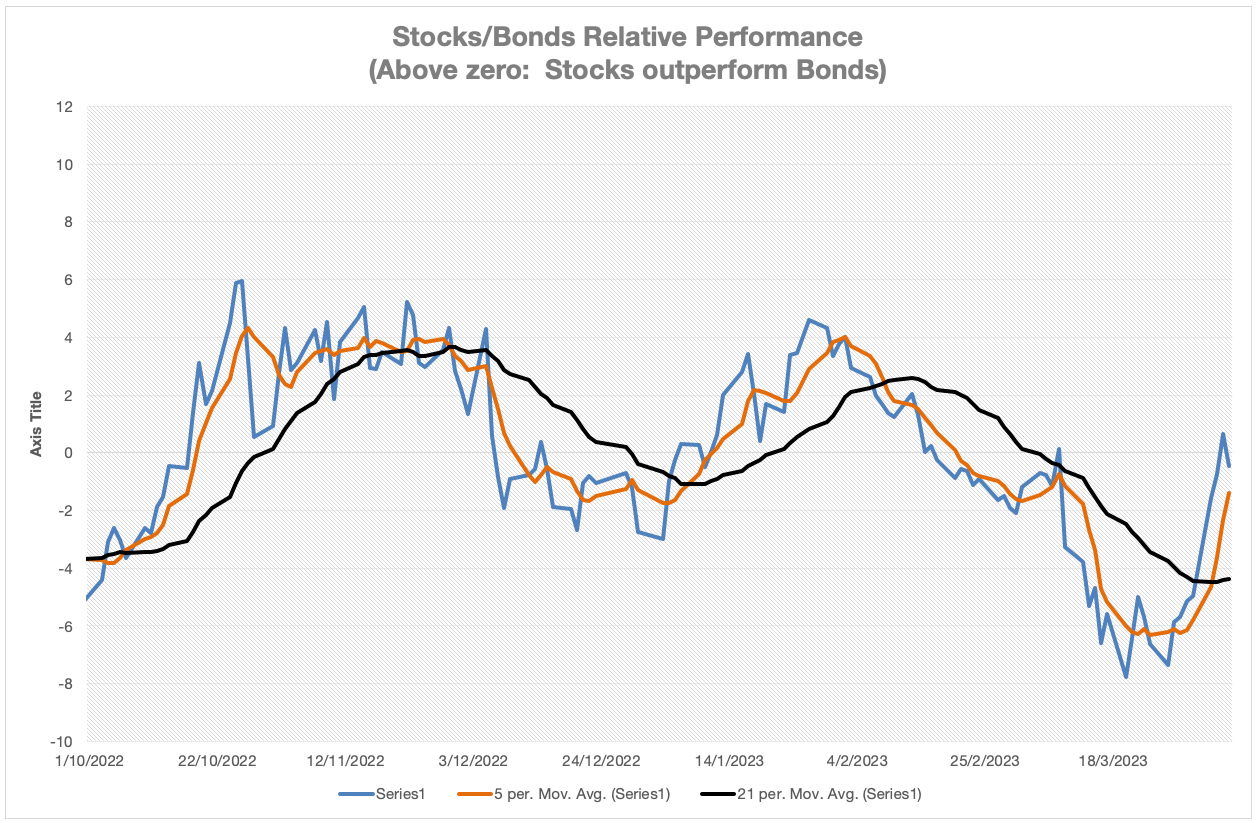
The recent strong 8-Day bullish rally took the Stocks/Bonds Ratio into an upside movement.
Then, the past couple of days has seen it equivocate. It nudged above the zero line, then fell back below the zero line. The zero line is the demarcation between medium tern bullish and bearish.
Historical and Implied Volatility.

When Historical Volatility falls below Implied Volatility - the market is usually in a short-term bullish trend. (HV is based on historical data of the XJO. Implied Volatility is based on data from the VIX Index.)
When HV gets down to around the 5 level, a reversal in the XJO trend usually occurs. HV is not far off that level.
(This is often a leading or co-incident indicator.)
% of Stocks above key moving averages.
1. % of stocks above 10-Day Moving Average: Last Week 77%, This Week 77%.
2. % of stocks above 50-Day Moving Average, Last Week 40%, This Week 51%.
3. % of stocks above 200-Day Moving Average, Last Week 50%, This Week 60%.
Stocks above the 10-Day MA has stalled this week at 77%. Medium term and long term the market improved.
Conclusion.
XJO has had a strong counter-trend rally but appears to be stalling at Horizontal Resistance.
I've outlined plenty of pluses and minuses, and maybes about the market this week. Nothing convincing one way or the other.
The coming week may be crucial for the near-term future of the XJO.
XJO resumes trading on Tuesday. America will resume on Monday so that could provide an indication of where our market will go.
Addendum.
Asian markets, which were not closed on Friday, were up, Japan +0.17%. Korea +1.27%, Hong Kong +0.28%, Shanghai +0.45%.
In America on Friday, Non-Farm payrolls indicated a slowing in employment. CNBC commented:
Nonfarm payrolls growth in March was about in line with expectations, but showed signs that the jobs picture is in the early stages of a slowdown.
That might give the American market hope for a slowing or pause in Federal Reserve interest rate rises and a boost to stock markets.
U.S. Futures were mildly positive on Friday. Dow Jones +0.19%, SP500 +0.23%, Nasdaq +0.1%.
That's all relatively positive for America on Monday night - but anything can happen. Wait for Tuesday morning.