Showing posts with label BHP. Show all posts

Thursday, April 27, 2023

Finspiration Australia.

 28/4/23.  Friday Morning Finspiration Report.

Overnight in the U.S.  Stocks up strongly.  Worries about banks went out the door with Tech surging strongly. AMAZON falls 2% after its report coming after the closing bell.


Dow Jones +1.57%.  SP500 +1.96%.  Nasdaq +2.43%.  Mid Caps +1.53%.  Small Caps +1.52%.  Banks +1.54%.
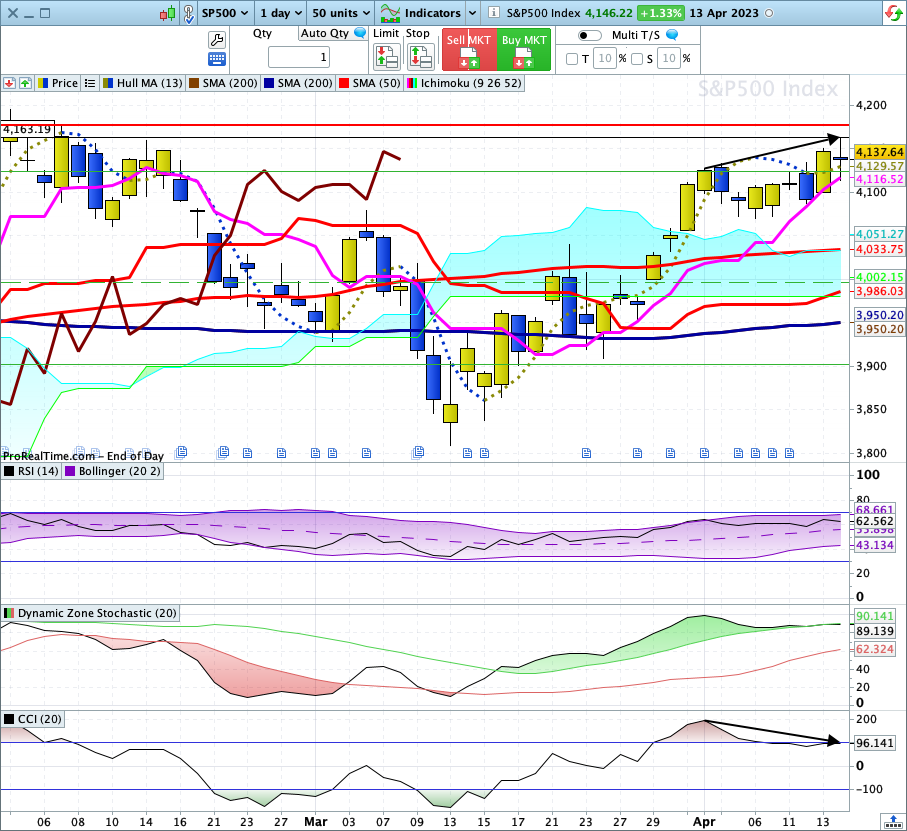
SP500


That's a big bullish candle on the SP500 and the index finished above the 8-DEMA and Supertrend turned bullish.  Those are usually reliable early buy signals.  But anything can happen in reporting season.

Amazon is down in extended trading after hours.  SNAP is now down -17% and Pinterest down -13%.  Tread warily.

Commodities.


Commodities Index +0.13%.  Energy +0.09%.  Base Metals +0.37%.  Agriculture -0.19%.  Gold +0.01%.

BHP up +1.2% overnight in New York.  Rio up +1.21%.

Overnight Oz Futures are up +0.75%, so we should have a good start to today's trading in Australia.


Friday, April 21, 2023

Finspiration Australia.

22/4/23.  Saturday Morning Finspiration Report. 

Yesterday in Australia, XJO fell moderately.

Overnight in the U.S., stock market was flat.


XJO down -0.43% and showing the first definite signs of bearishness.  Hull MA13 (dotted line) has turned down and the chart finished below the 8-Day EMA.

Yesterday's dark candle, after two dojos, is a bearish signal.

DZ Stochastic closed below its upper Zone line.  That needs to be confirmed by a close by the RSI below its median line (20-Day MA) and short-term MACD (yellow) closing below longer term MACD (blue).

Overnight in America.


Dow Jones +0.07%.  SP500 +0.09%.  Nasdaq +0.11%.  Mid Caps -0.06%.  Small Caps -0.32%.  Banks -1.5%.

SP500.


SP500 has had two doji candlesticks in a row.  It remains just a tick above the 8-Day EMA and the past two days have bounced of the first of the triple Superintends.

RSI remains a tick above its median line (20-Day MA).  A drop below the 20-Day MA is bearish.

DZ Stochastic is bearish and short-term MACD is below long-term MACD.

Lots of indecision with two dojis and mixed indicator signals.  Wait.

Commodities.  Energy up, Base Metals down.

Commodities Index -0.21%.  Energy +0.83%.  Base Metals -1.16%.  Agriculture -0.66%.  Gold -0.99%.

With U.S. Banks and Base Metals down overnight, that looks dangerous for Australia on Monday.

Overnight in the U.S., our big miners were down.  BHP -3.23%, Rio -4.04%.  That re-inforces the notion that XJO will be down on Monday.


Friday, April 14, 2023

Finspiration Australia.

15/4/23.  Saturday Finspiration Report. 

XJO up on Friday.  Dow Jones down on Friday night.


XJO, after starting on the down-side on Friday, finished on the high-side, up +0.51%.  It remains stalled at horizontal resistance where it's been for the past three days.

The trend remains up - so stay with the trend until we see definite signs of a pull-back.

Overnight in America.

Dow Jones -0.42%.  SP500 -0.21%.  Nasdaq -0.36%.  Mid Caps -0.52%.  Small Caps -0.79%.  Banks +1.09%.

SP500.


Last night's candle was a "doji" indicating indecision.

SP500 is stalling at horizontal resistance and CCI is showing negative divergence.

DZ Stochastic has marginally broken below its upper Zone line - the first suggestion of a "sell" signal.  This needs confirmation by a move by RSI below its middle line - its 20-Day MA.

Commodities.


Not much movement in Commodities except for Gold.

Commodities Index +0.12%.  Energy +0.09%.  Base Metals +0.1%.  Agriculture +0.19%.  Gold -1.77%.

The Gold chart has left and "evening star" doji candle-stick from Thursday night.  That's often a sign of a pull-back.  But the chart has been left sitting on the 20-Day MA - so it could bounce here.

Overnight in the U.S., BHP was down -1.79% and Rio was down -1.89%.

Bitcoin.

Bitcoin in USD was up +0.63% last night and remains bullish.

(I don't have an up-to-date chart yet, but will put one up when it becomes availble.)


Wednesday, April 5, 2023

Finspiration Australia.

 5/4/23.  Australian market finishes flat today.


XJO finished just up today, +0.02%.

Today's candle is a doji which is often an ominous signal coming at the top of an up-trend.

Today was the eighth day to the upside.  That's getting a bit old for a short-term up-trend.  Of course, it can go higher, but the probabilities now lie to the downside.

Despite the marginal upside finish, breadth was good with nine out of eleven sectors finishing in positive territory.

Negative sectors today were in the resources:  XMJ (Materials) -0.6% and XEJ (Energy) -0.6%.

Amongst the large cap stocks today, BHP -1.5% and Rio -0.9% were the worst performers.

Best performer was Telecommunications +0.8%.  Three sectors recorded rises of +0.7%: XIJ, XNJ and XHJ.  Those three sectors are now sitting at strong overhead resistance - adding weight to the idea that we may see a pull-back.


Tuesday, April 4, 2023

Finspiration Australia.

 4/4/23.  Tuesday Evening Finspiration Report.

Reserve Bank Interest Rate Day - A Fizzer?


XJO finished higher today - up just +0.18%.

Interest Rate Day often produces some sharp movements in the market - but not today.  After the "No Change" announcement, XJO did move higher but not much, up 14 points or +0.19%.  That's not a lot compared to what it can do on IRD.

Notice how the XJO moved up in the five minutes before the interest rate announcement.  Somebody (or somebodies) seems to have pre-empted the IR announcement.  I suspect it occurred while there was some unseen selling going on in the background - two bob each way.  If it goes down, the punter/s exits the buy side and let the sell side cascade down.  If it goes up - exit the sell side and enjoy the ride.  Remember that HFT Algorithms react in a milli-second, and large institutions act within one second.  No retail trader can hope to compete in these sudden changes in direction.

Nine out of eleven sectors were up today.  A big hit was taken by XMJ (Materials), down -0.9%.  BHP, the largest stock in that sector, was down -2.2% today.

Best sector was Energy, up +1.3%.  It got a push higher from oil price rises overnight - as a result of cuts by OPEC to their output.

Here's the XMJ Chart:

XMJ finished the day below the Short-Term Line (3-DEMA) but remains above the 8DEMA (dashed line).  A finish below that would be short-term bearish.


Friday, March 3, 2023

Finspiration Australia.

 4/3/23.  Finspiration Saturday Morning Report.

XJO up Friday.  Overnight in the U.S., Stocks lift for second day.

XJO rose +0.39%


XJO has been up three out of the past four days.  Advance has been turgid.  The index hasn't been able to break above the 8-DEMA.  Perhaps that will change after events overnight in the U.S.

U.S. Indices.


Dow Jones +1.17%.  SP500 +1.61%.  Nasdaq +1.97%.  Small Caps +1.14%.  Banks +1.92%.

SP500.


Friday saw follow-through buying after Thursday's bullish candle.  The chart is now above the 8-DEMA - that provides a move to a short-term upside trend.

The chart is now into the "neutral zone" where we might see some consolidation.  While the index remains above the 8-DEMA - stay with the trend.  

Commodities Index up, Base Metals flat.


Commodities Index +1.58%.  Energy +2.35%.  Base Metals -0.05%.  Agriculture +1.59%.  Gold +1.07%.

In New York, BHP was up +1.29%, Rio up +1.95%.

Bitcoin.


Bitcoin down -4.99% overnight.  That was a break to the downside of the consolidation zone.  There might be a bit more downside before another move up.

The 50-Day MA has crossed above the 200-Day MA which would complete a "Golden Cross", a bullish event.

Saturday, February 25, 2023

Finspiration Australia.

     26/2/23.  Weekend Report - The Week That Was.  Week Ended 24/2/23.

XJO Monthly Chart.


After almost four weeks, XJO down so far -2.27% after stalling at the top of the strong January candle.  XJO has also reached a zone where it has failed in the past.

So far, the Index is above the 8-MEMA, Hull MA13, 50-MMA, 200MMA, Supertrend (7/1.5).  Not much damage done yet.
  
Monthly RSI is at 54.68.  50 represents the dividing line between bullish and bearish.

XJO Weekly Chart.


XJO remains in an up-trend, with higher highs and higher lows.  In the past five days, XJO fallen -0.54%.

XJO began to fall three weeks ago at a major resistance level.  

8-Week EMA and Hull MA13 turned turned down, which is bearish. Supertrend is providing support at this moment.  Events overnight in America could see a break to the downside of Supertrend.

Weekly RSI is at 55.2 - bullish but falling.  

CCI remains above its zero line (but falling).  It's been above its zero line since 24 Oct. 2022.  That marked the start of this bull market.


XJO Daily Chart.


XJO was in a strong up-trend in January.  It is currently in a short-term down-trend.

Daily RSI has fallen below its mid-line of 50.  That's bearish

XJO may be finding support at the 50-Day MA.   As stated previously, events on Friday in America could see a decisive break below that support level.

Weekly Changes in Sectors.

Despite the fall in the XJO this week of -0.54%, breadth was quite healthy.  Only two sectors fell this week, XMJ (Materials) -2.96% and XDJ (Discretionary) -1.23%.  XSJ (Staples) was flat, +0.09%

A couple of sectors showed quite healthy gains, XUJ (Utilities) +6.05% and XPJ (Property) also +6.05%.

The damage to the XJO was mainly done by XMJ (Materials) after both BHP and RIO presented gloomy reports to the market.  That's largely a result of events in China, where the country was in lock-down for the second half of 2022 - the time covered by the reports from BHP and Rio.  (The biggest markets for those two countries are in China.)


Monthly, Weekly and Daily RSIs. - Sectors + XJO + Gold + Composite Bonds.


This week's chart:


Each sector has three bars representing the RSI on Monthly, Weekly and Daily bases.

The following is a rough guide to interpreting the chart.

Bullish:  Rising bars.
Bearish:  Falling bars.
Counter trend rally:  Falling then rising.
Pull-back:  Rising then falling.

Bullish Sectors: XIJ, XNJ.
Bearish Sectors:  XXJ, XMJ, XEJ.
Counter trend Rally:  XUJ, XPJ.
Pull-back:  XDJ, XTJ, XHJ, XSJ.

XJO is in pull-back mode.  Composite Bonds (IAF) and Gold (XGD) are also in pull-back mode.


NewHighs-NewLows.

This is a long-term indicator, but a good guide for long-term investors.


NH-NL have been pulling back since the end of January.  That's a warning sign to long-term investors to stay defensive,

Stocks v Bonds.  Relative performance.

On a relative basis, Bonds are currently outperforming Stocks, i.e., the chart is below the zero level.

This is a reasonable picture of bullish and bearish status of the market.  It's probably a good idea to remain bearish on stocks while this chart remains below zero.


% of Stocks above key moving averages.

1.  % of stocks above 10-Day Moving Average: Last Week 42%, This Week 44%.  
2.  % of stocks above 50-Day Moving Average, Last Week 61%, This Week 56%.  
3.  % of stocks above 200-Day Moving Average, Last Week 70%, This Week 65%.

In the short-term, breadth, as measured by stocks above the 10-Day MA, improved a little this week as indicated by the Sector changes shown above.

The longer term measures remain above the 50% mark.  So the market is not in bad shape.

SP500.

I mentioned early in this report, the poor results in America on Friday.  Here's the SP500 chart.


SP500 began a steep decline six days ago and has fallen five of the past six days.  Friday saw a fall of >1%.  That could result in a follow-on fall in the XJO on Monday.

But a lot of strange things are happening in this chart.  Three of the candles show "hang-man" candles.  A small body at the top of the candle and a very long lower wick.  That indicates plenty of intra-day buying.

Although the bears have been dominant in the past six days, bulls have been fighting good rear-guard actions on three of the days, pushing back against the bulls.

The chart is now down to a crucial level.  It bounced strongly off the 200-Day MA on Friday despite the initial big fall.  Such action could spell the end of this push down by the bears.  We need to see a big upside candle on the SP500 on Monday to be confident that this fall is over - at least in the short-term.

It would be very interesting on Monday if the XJO pre-empts the SP500 by rising, or at least showing good strength in intra-day trading


Conclusion.
 
February has been a poor month for the XJO.  Although the past week showed a net loss for the XJO, internal strength wasn't nearly as pessimistic as suggested by the -0.54% fall in the XJO.

The long-term trend for the XJO is still bullish with higher highs and higher lows. 

Markets here and in the U.S. are now at a crucial stage.  Watch carefully for events on Monday.


Tuesday, August 9, 2022

Finspiration Australia. Chart Analysis for Australian and International Stock Markets.

10/8/22.  Overnight U.S. stocks fall.  Tech hard hit.


Dow Jones -0.19%.  SP500 -0.42%.  Nasdaq -1.19%.  Small Caps -1.44%.  Banks +0.45%.

European stocks also fell with the Euro Stoxx 50 down -1.11%.

SP500.


The modest fall in the SP500 keeps it in short-term and medium-term up-trends.  The longer term remains in doubt with the Index below the 200-Day MA.

The negative divergence on CCI suggests further falls down from the Horizontal Retracement Zone, 50%-61.8% of the fall earlier this year.

Plenty of near-by support may cushion any further falls.

Tonight in the U.S., CPI data is released.  If inflation ticks higher, the Fed. may be more aggressive in its next interest rate rise.

Commodities.  Out of step with Stocks.


Commodities Index +0.93%.  Energy +0.95%.  Base Metals +1.42% and up to the 50-Day MA, Agriculture +0.4%.  Gold tipped above its 50-Day MA, up +0.31%.  Expect more upside in Gold.

Iron Ore -1.5%.  Thermal Coal +3.6%.

Lots of plusses and minuses for Australia in the overnight data.  Stronger base metals, Energy and Banks should limit losses today in Australia.

After 15 minutes of trading, XJO is down -0.47%.  BHP is flat +0.05%, but Rio has risen +0.57%.  


Monday, June 20, 2022

Finspiration Australia. Chart Analysis of Australian and International Stock Markets

 Overnight.

NYSE closed overnight.

In Europe stocks rose strongly with EuroStoxx600 up +1%.  German DAX +1.06%.  Bank stocks up about +3%.  

DAX remains in non-trending mode with both Span A and Span B of the Kumo Cloud parallel to each other.  

Commodities.

Brent Crude Oil +0.9%.  Copper -0.3%.  Iron Ore -2.6%.  

In the U.K. BHP fell -1.6% and Rio -1%.  Those figures aren't too bad as in Australia yesterday BHP fell -5.3% and Rio -5.06%.

Overnight Oz Futures are up +47 points or +0.7%.

Yesterday in Australia, XJO down -0.64%, so our market on present indications should gain back most of yesterday's losses.


Tuesday, May 17, 2022

Finspiration Australia. Chart Analysis for Australian and International Stock Markets.

18/5/22.   Overnight.


Dow Jones +1.34%.  SP500 +2.02%.  Nasdaq +2.76%.  Small Caps +3.02%.  Banks +3.9%.

Euro Stoxx50 up +1.52%.

Despite the current rally, all of the above remain in a down-trend.  An up-trend can be declared when we see a higher high and a higher low.

SP500.


Two out of three Super-trend Lines have now switched to yellow (bullish).  Hull MA13 has switched to yellow (bullish).

Divergences on CCI are a leading indicator for a short-term trend change.  See Above.

Commodities.


Commodities Index -1.09%.  Energy -2.09%.  Base Metals +1.26%.  Agriculture +0.53%.  Gold -0.63%.

Iron Ore -0.7%.  Thermal Coal +2.8%.

Overnight Oz Futures +0.9%.

Overnight in the U.S., BHP up +3.25%, RIO +3.59%, Woodside +1.99%.

Wednesday, April 27, 2022

Finspiration Australia. Technical Analysis of the Australian and International stock markets.

 28/4/22.  Overnight.  Nasdaq flat, DJ up a little.


Dow Jones +0.19%.  SP500 +0.21%.  Nasdaq -0.01%.  Small Caps -0.37%.  Banks -0.65%.

European STOXX600 was up 0.6%

SP500.


SP500 has stabilised at support.  The long lower tail on last night's candle indicates intra-day buying which might indicate we are at a low for this retracement. W e need to see a sizeable upside move tonight to confirm a bottom is in.

The index is oversold with the RSI at 33.6, so the chances of a bounce hers are high.

Commodities.


Commodities Index +0.7%.  Energy +0.76%.  Base Metals +0.82%.  Gold -0.76%.

Iron Ore +0.1%.

In London, RIO was up +4.1% and BHP up 4%.  That looks promising for the big miners today.

Overnight Oz Futures up +0.5%.  That should ensure a good start to the morning's trade in Australia.

Tuesday, April 19, 2022

Finspiration Australia. Technical Analysis of Australian and International Stock Markets.

 20/4/22.  Overnight.  U.S. equities up strongly.


Dow Jones +1.45%.  SP500 +1.61%.  Nasdaq +1.9%.  Small Caps +1.9%.  Banks +2.18%.

SP500.


Despite last night's strong rise, SPX remains in a consolidation pattern.  Some indicators are bullish, some suggest plenty of upside resistance just overhead.  A further break to the upside would overcome the negatives.

Commodities.


I suggested yesterday that further upside in Energy looked in doubt.  Last night, Energy fell heavily, down -3.48%, which took the Commodities Index down with it, DBC -2.57%.  Base Metals also suffered, DBB -1.22%.  Gold -1.51%.

Iron Ore -1.1%.

Overnight Oz Futures up +0.6%.  That should ensure a strong start to the day.

Rio has announced new production results for the first quarter.  Pre-market price for Rio shows a positive expectation for the opening, but BHP is flat, affected by those poor metals and energy prices overnight.  

KKR has made a non-binding offer for Ramsay Health Care of $88 per share.  In the pre-market, RHC is up nearly 25%.  That will have a big effect of the Health Sector (XHJ).

According to Jim Cramer, from CNBC's Mad Money, the U.S. market had no business rising last night with so many negatives against it.  Read his comments here on why it did.

Comments above are my personal ideas and remain probabilistic and contingent.  Do your own research.

Wednesday, March 30, 2022

Finspiration Australia. U.S. equities down. Tech hard hit.

 Overnight.


Dow Jones -0.19%.  SP500 -0.63%.  Nasdaq -1.21%.  Small Caps -1.84%.  Banks -2.21%.

European stocks also fell, with STOXX600 down -0.4%.

SP500.


Last night's action looks like the start of a pull-back portended by the negative divergence on the CCI.  Traders will look to buy the dip - a likely support is the Ichimkoku Cloud and the 200-Day MA.

Commodities.


Commodities Index +1.8%.  Energy +1.91%.  Base Metals +2.23%.  Gold +0.8%.

Iron Ore +0.4%.

Those good Commodity and IO figures should give Ozzie resources a boost today.

Overnight Oz Futures are up a little, 10 points or +0.1%.

Overnight, BHP was up +3.1% in the U.S. after falling yesterday in Australia just a little -0.08%.


Friday, December 10, 2021

Stock Market Analysis.

 Sat. 11/12/21.  SP500 hits new record.

Overnight:


Dow Jones +0.6%.  SP500 +0.95%.  Nasdaq +0.73%. Small Caps +0.02%.  Banks -0.2%

SP500:


SP500 reversed the bearish candle set on Thursday, broke above resistance and set a new closing record.  That's a bullish event.  Expect more upside.

Commodities:


Commodity Index +1.14%.  Energy +1.95%.  Base Metals -0.52%.  Gold +0.42%.

VIX.


VIX finished at 18.69.  Traditionally, 20 is considered the marker between bullish and bearish for the stock market.  VIX is now giving a bullish signal confirming the signal from the SP500.

BHP was up in the US, but down in little in the UK.  RIO had similar results to BHP, up in the US, down in UK.  Both stocks remain in up-trends.  Westpac and Woodside were both up in the U.S.

Our market should see a bounce off the 50-Day MA on Monday.


Finspiration Australia. 14/11/23. Tues. Morning Report.

Mixed Results in New York.  Energy up. NAB ex-dividend today. Dow Jones +0.16%.  SP500 -0.08%.  Nasdaq -0.11%.  Small Caps -0.07%.  Banks -0...