Showing posts with label Utilities. Show all posts

Saturday, February 11, 2023

Finspiration Australia

   12/2/23.  Weekend Report - The Week That Was.  Week Ended 10/2/23.

This week has seen a dramatic change in investor sentiment.  The previous week, the market was all gung-ho and seriously overbought.  This week, investors sobered up and a pull-back has started.

XJO Monthly Chart.


We've only had ten days so far in February.  XJO down so far -0.58% stalling at the top of the strong January candle.  XJO has also reached a zone where it has failed in the past.

So far, the Index is above the 10-MMA, Hull MA13, 50-MMA, 200MMA, Supertrend (7/1.5).  Not much damage done yet.
  
Monthly RSI is at 56.57.  50 represents the dividing line between bullish and bearish.

XJO Weekly Chart.


In the past five days, XJO fallen -1.65%.  

The weekly chart shows a bearish engulfing candle.  That's occurred at a major resistance zone.

Candlesticks are a graphic depiction of buying and selling in the market.  A big dark engulfing candle shows the sellers were in complete control of trading this week.

8-Week EMA, Hull MA13 and Supertrend remain in bullish configurations, so not a lot of damage done yet.

Weekly RSI is at 60.58 - bullish but falling.  

Stochastic was showing a negative divergence and has now turned down below its signal line.


XJO Daily Chart.


XJO was in a strong up-trend in January.  That's all changed now.

Daily RSI is now at 53.71 - that's well below the weekly RSI of 60.58.  A fall by the Daily RSI below the Weekly RSI is indicative of a pull-back.  That's not something to trade from - but a filter to alert you to look at the charts and trade the charts.

Daily RSI remains above the bullish level of 50.

The indicator overlays on the chart (8-DEMA, Hull MA and Supertrend) all indicate the dramatic nature of the reversal that's occurred in the XJO.

STW Daily.

XJO can be a bit deceptive on a chart as it always opens at the same level as the previous day's close.  Never any gaps on an XJO chart.

STW is a tracking ETF for the XJO and can often give clues as to investors' thinking not available from the index.

The above chart shows a big gap opening to the down-side on Friday and breaking below key indicators (8-DEMA, Hull MA and Supertrend).  That's a key sign that a trend reversal has occurred.

Of course, the market always tries to play with the minds of investors.  Looking at the right hand side of the chart, an investor might think that further downside is immediately probable.  But looking at the left hand side of the chart shows a key support at 67.08.  STW closed at 67.07 on Friday - so we might get some upside here before another move to the downside.  

Monthly, Weekly and Daily RSIs. - Sectors + XJO + Gold + Composite Bonds.


This week's chart:


In the week prior to this now, five sectors out of eleven were 70 RSI.  Now there are none, with only one sector above 60 - XXJ - but it is also in pull-back mode.   

Bullish sectors with RSIs arranged in ascending order are:  XDJ, XIJ, XSJ.  In the previous week, eight sectors were bullish.  That's a big change in breadth.

Sectors in pull-back mode (Daily RSI falling below Weekly RSI) XXJ, XMJ, XEJ, XTJ, XHJ, XUJ, XPJ and XNJ.  That's eight out of eleven sectors.

Gold (an industry group within XMJ) is in pull-back mode. 

On the daily time-frame, we've switched from eight out of eleven bullish sectors, to eight out of eleven sectors in pull-back mode.


NewHighs-NewLows Cumulative.

This is a long-term lagging indicator, but a good guide for long-term investors.


NH-NL Cum is represented by the blue line.  It is now marginally above the 10-DAY MA but remains well above the 21 and 34 Day Moving Averages.  The Moving Averages are all aligned in bullish fashion from 10DMA at the top, then 21, then 31.  This provides a buffer against pull-backs.

I've developed another long-term metric "StrongStocks-WeakStocks" which is similar to NH-NL but gives signals a little earlier than NH-NL  SS-WS is up for the 13th week in a row and has moved well above its 5-Week MA.   This week there were only 6 Strong Stocks compared to 34 the previous week.  Weak stocks remained at four.   While this remains above its 5-Week MA, long-term investors can remain calm.


% of Stocks above key moving averages.

1.  % of stocks above 10-Day Moving Average: Last Week 67%, This Week 26%.  
2.  % of stocks above 50-Day Moving Average, Last Week 78%, This Week 61%.  
3.  % of stocks above 200-Day Moving Average, Last Week 76%, This Week 71%.  

All metrics have pulled back, but only the shortest time-frame one is showing bearish tendencies.  At this stage, we are seeing a pull-back and nothing more serious.


Stocks above 200-Day MA have fallen from 76% to 71% but remain above the 5-Week MA.


Conclusion.
 
Daily chart of XJO was in a strong uptrend.  That has now reversed to the downside.

STW (ETF for XJO) suggests we could see some consolidation here or some upside in the near term.  

Overall, however, investors' mind-set has now taken a turn for the worse.  Expect more downside before this pull-back is over.


Friday, July 22, 2022

Finspiration Australia. Chart Analysis for Australian and International Stock Markets.

23/7/22.  Yesterday in Australia.


XJO chart shows a doji candlestick which indicates indecision.  The index finished flat -0.04%.  That comes at a major horizontal resistance level, so the next move may be to the downside.

The market is in a short-term up-trend but a long-term down-trend.  So we can count the current rally as a counter-trend rally.

Stochastic is overbought.  It can remain overbought for lengthy periods of time, but in a bear market the period of time is usually brief.  Watch for a break below 80 for an end to this rally.

Overnight in America.

Dow Jones -0.43%.  SP500 -0.93%.  Nasdaq -1.87%.  Small Caps -0.94%.  Banks -1.52%.

Earnings season produced some big falls yesterday, particularly among social media stocks.  META (Facebook) was down -7%.  Pinterest -13%, SNAP -39% and Alphabet -5%.

Eight out of eleven sectors were down.  The only positive sectors were Consumer Staples +0.66%, Utilities +1.37% and Real Estate +0.76%.  Real Estate got a boost from lower bond yields.  They usually also provide a boost to Technology, but that was weighed down by poor earnings.

SP500.


SP500 is now into the Kumo Cloud - that's a "no trade" zone, so we might see a more turbulent market here.  A break back below the Cloud would be a bearish event.

The Cloud is quite wide here, which means resistance is strong.  The most likely movement, medium term, is back to the downside.  But the market will remain captive to earnings reports.

Commodities.


Mixed results in Commodities.  Commodities Index -1.19%.  Energy -0.81%.  Base Metals -0.6%.  Agriculture -1.53%.  Gold +0.25%.

The lower bond yields in America and good metals prices might help the XJO to some extent on Monday, but I'm not expecting a positive day.


Saturday, April 16, 2022

Finspiration Australia. Objective Technical Analysis of the Australian and International Stock Markets

Weekly Wrap - Week ending 15 April, 2022.

XJO Monthly Chart.


March was a good month for the XJO, up +6.39%.   April has begun with a consolidation period, after two weeks it is up just +0.32%%.  8-Month EMA and Hull MA13 have both turned bullish.  It's early days in the month of April, so we need more time to see if this bullish bias can hold for the rest of the month.  At this stage, it is looking promising.

Weekly Chart.


XJO was positive this week, +0.61%. That maintains the medium-term bullish trend.
It remains above the 8-Week EMA, Supertrend (1.5/7) and  Hull Moving Average remain bullish.  Any pull-back is likely to be bought.

Daily Chart.


By the end of this week, XJO strengthened with the 8-Day EMA and Hull MA13 both turning short-term bullish.  The Supertrend (1.5/7) may be indicating a resistance level.

Using multiple time-frame analysis, Monthly and Weekly XJO remain bullish.  Daily XJO has also now turned bullish.  This is now a risk-on market.

Relative Strength of Sectors - past 52 days.


This chart compares the performance of each sector against the performance of the XJO.  Sectors above zero have outperformed the XJO over the past 52 days.  Sectors below zero have underperformed XJO over the past 52 days.  Eight Sectors were up this week and three down.  Gold (an Industry Group part of Materials) has had an exceptional week.

As a general rule, look for stocks in the best sectors and avoid stocks in the worst sectors.  For example, look to Utilities (XUJ), Energy (XEJ) and Materials (XMJ) for stocks to buy.  Avoid Consumer Discretionary (XDJ), Information Technology (XIJ) and Property (XPJ).  (Exceptions to that general rule could occur.)  XUJ is now very overbought and probably not a serious contender for current buying - look to buy the dip.


New Highs - New Lows Cumulative.

NH-NL Cumulative is in a consolidation phase and has just tipped under its 10-Day Moving Average, that's a caution sign for long-term investors.  Further deterioration should be taken seriously.


% of Stocks above key moving averages.

1.  % of stocks above 10-Day Moving Average, 52%.
2.  % of stocks above 50-Day Moving Average, 69%.
3.  % of stocks above 200-Day Moving Average, 56%.

All three are above 50% level - that confirms the risk-on status of the market.

Bonds versus Stocks.


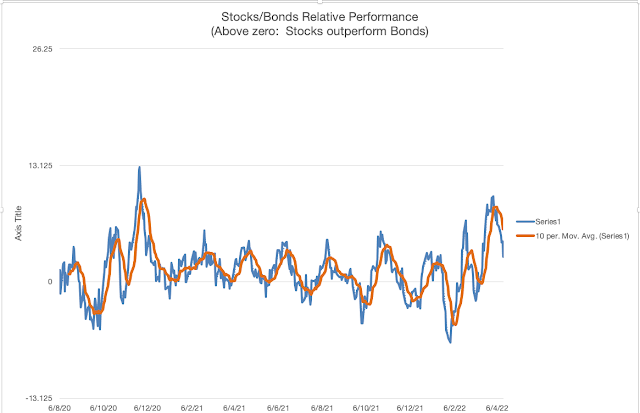
At the end of the week, Stocks had a clear advantage over Bonds.  

The relativity has weakened a little with the chart now below its 10-Day MA.  That's not necessarily a bearish signal - it's just that bonds are doing a little better in the past few days than they have in recent times.  Stocks are still the preferred option while the chart remains above zero.

Strong Stocks versus Weak Stocks.

Amongst the ASX100 stocks, I have 15 strong stocks and 10 weak stocks.  That still provides a bullish bias to the market.  But the number of weak stocks has steadily increased over the past four weeks.  Five weeks ago they stood at zero, now they are up to fifteen.  The market is becoming a little unbalanced, not dangerously - but we may be seeing some big internal shifts in the market.  

Eleven of the fifteen strong stocks came from Materials and Energy.  Add to that two from Utilities, which tends to correlate with Energy, we can see just how unbalanced the market is becoming.  A set-back for Materials and Energy could be a set back for the whole ASX.   Stay vigilant.

Conclusion.

 The monthly, weekly and daily charts remain positive and in sync.  While they remain in sync, we have a risk-on market.

Traders should concentrate on the strongest sectors:  Utilities, Materials and Energy.

Wednesday, April 13, 2022

Finspiration Australia. Objective technical analysis of the Australian and International stock markets.

 XJO up modestly today +0.34%.

The index saw upside buying in the afternoon, which added some respectability to the final result.

The last five days have seen the XJO in a consolidation pattern - losing interest before the long Easter weekend.

Most sectors were up today - the only negative was Property, down -0.5%, but two other sectors were flat, Information Technology and Telecommunications.  

The best performers were the resources with Energy up +0.6% and Materials up +0.6%.  Utilities close behind at 0.5%.

I can't see much happening tomorrow.

Thursday night (Oz time) U.S. reporting season sees some of the big banks reporting.  That could be market changing, but our market doesn't open until the following Tuesday.


Saturday, April 9, 2022

Finspiration Australia. Weekly Wrap, week ended 8/4/22

          XJO down this week.  

XJO Monthly Chart.


March was a good month for the XJO, up +6.39%.   April has begun with a consolidation period, down just -0.29%.  8-Month EMA and Hull MA13 have both turned bullish.  It's early days in the month of April, so we need more time to see if this bullish bias can hold for the rest of the month.

Weekly Chart.


XJO was negative this week, -0.21%. That's the first negative week after three weeks up in a row. 
The chart, however, is remains bullish.  It has moved above the 8-Week EMA, Supertrend (1.5/7)  Hull Moving Average remain bullish.  Any pull-back is likely to be bought.


Daily Chart.


This week, XJO weakened with the 8-Day EMA, Supertrend (1.5/17) and Hull MA13 all turning short-term bearish.

Using multiple time-frame analysis, Monthly and Weekly XJO remain bullish.  Daily XJO has turned bearish.  Wait for all three to be in sync before adding more money to this market.

Relative Strength of Sectors - past 52 days.


This chart compares the performance of each sector against the performance of the XJO.  Sectors above zero have outperformed the XJO over the past 52 days.  Sectors below zero have underperformed XJO over the past 52 days.

As a general rule, look for stocks in the best sectors and avoid stocks in the worst sectors.  For example, look to Utilities (XUJ), Energy (XEJ) and Materials (XMJ) for stocks to buy.  Avoid Consumer Discretionary (XDJ), Telecommunications (XTJ) and Health (XHJ).  (Exceptions to that general rule could occur.)  


New Highs - New Lows Cumulative.

NH-NL Cumulative this week returned to its 10-Day Moving Average, a break below would send a big caution signal to long-term investors.


Bonds versus Stocks.


At the end of the week, Stocks had a clear advantage over Bonds.  The relativity has weakened a little with the chart now below its 20-Day MA.  The chart is only a little below its recent high, which was the best its been since late November, 2020.  Extremes like this are often contrarian signals.  

Conclusion.

after three weeks of strong gains, the XJO pulled back a little this week, with the daily chart now short-term bearish.  The weekly and daily charts remain positive.  Wait for the three time scales to come back into sync.

Traders should concentrate on the strongest sectors:  Utilities, Materials and Energy.

Finspiration Australia. 14/11/23. Tues. Morning Report.

Mixed Results in New York.  Energy up. NAB ex-dividend today. Dow Jones +0.16%.  SP500 -0.08%.  Nasdaq -0.11%.  Small Caps -0.07%.  Banks -0...