Showing posts with label trend. Show all posts

Tuesday, May 9, 2023

Finspiration Australia.

9/5/23.  Tuesday Evening Finspiration Report. 

XJO down marginally today -0.17%.

Below is an equivolume chart for STW, a tracking ETF for the XJO.


STW finished above its 8-Day EMA and the Supertrend remains bullish.

DZ Stochastic and DZ RSI have crossed above their signal line.

The picture looks bullish.

Volume has been light - which puts some date on the strength of this upside move.

We are, however, in a short-term upside rally - so stay with the trend.


Tuesday, April 25, 2023

Finspiration Australia.

 26/4/23.  Cryptos report.

Major Cryptos maintain bearish conditions - but close to changing.

BTCUSD.


Good night for BTC, up +2.86%.  It bounced off the 50-Day MA.  

DZ Stochastic has given a marginal buy signal and it finished marginally above the 8-Day EMA.

I'd like to see the RSI finish above the 20-Day MA and at least one Supertrend trigger a yellow line (bullish).

ADA


ADA up +2.84%.  A strong result but no buy signals triggered.  Wait.

MATIC.


MATIC down -1%.  The day's candle is a wide-range doji candle.  Coming at the low end of a down-trend, that may signal an end of the down trend.  But no buy signals triggered.  Wait.


Friday, April 14, 2023

Finspiration Australia.

15/4/23.  Saturday Finspiration Report. 

XJO up on Friday.  Dow Jones down on Friday night.


XJO, after starting on the down-side on Friday, finished on the high-side, up +0.51%.  It remains stalled at horizontal resistance where it's been for the past three days.

The trend remains up - so stay with the trend until we see definite signs of a pull-back.

Overnight in America.

Dow Jones -0.42%.  SP500 -0.21%.  Nasdaq -0.36%.  Mid Caps -0.52%.  Small Caps -0.79%.  Banks +1.09%.

SP500.


Last night's candle was a "doji" indicating indecision.

SP500 is stalling at horizontal resistance and CCI is showing negative divergence.

DZ Stochastic has marginally broken below its upper Zone line - the first suggestion of a "sell" signal.  This needs confirmation by a move by RSI below its middle line - its 20-Day MA.

Commodities.


Not much movement in Commodities except for Gold.

Commodities Index +0.12%.  Energy +0.09%.  Base Metals +0.1%.  Agriculture +0.19%.  Gold -1.77%.

The Gold chart has left and "evening star" doji candle-stick from Thursday night.  That's often a sign of a pull-back.  But the chart has been left sitting on the 20-Day MA - so it could bounce here.

Overnight in the U.S., BHP was down -1.79% and Rio was down -1.89%.

Bitcoin.

Bitcoin in USD was up +0.63% last night and remains bullish.

(I don't have an up-to-date chart yet, but will put one up when it becomes availble.)


Thursday, April 13, 2023

Finspiration Australia.

 14/4/23.  Friday Morning Finspiration Report.

U.S. records another solid upside move.


Dow Jones +1.14%.  SP500 +1.33%.  Nasdaq +1.99%.  Mid Caps +0.69%.  Small Caps +0.84%.  Banks +0.73%.

SP500.


The SP500 remains in a strong upside rally, but the negative divergence on CCI suggests it may be on its last legs.

SP500 had a good run, but it might be too late to start buying into this rally now.  I'll be waiting on a pull-back.

Commodities.

Commodities Index +0.00%.  Energy -0.74%.  Base Metals +1.84%.  Agriculture -0.48%.  Gold +1.35&.

After 30 minutes of trading this morning, XJO is down marginally -.03%, it's never a good sign when the Oz market starts weak after a strong night on Wall Street.

Bitcoin.

Bitcoin continues on its merry (bullish) way, up last night +1.68%.  It has successfully tested major horizontal support/resistance.  I'd expect more upside.


Wednesday, April 12, 2023

Finspiration Australia.

 12/4/23.  Wednesday Evening Finspiration Report.

XJO was up moderately today, +0.47%.


XJO is in a strong up-trend.  Today it reached a horizontal resistance level and encountered some intra-day selling.

The Index remains above the 50-Day Moving Average so we might see the Index come  back and test that as support.  If that test is successful and the index bounces - we should see more upside.

RSI and DZ Stock are both strong and in no danger at this stage of giving a sell signal.

Stay with the trend.

Tuesday, April 11, 2023

Finspiration Australia.

 11/4/23  Tuesday Evening Inspiration Report.

XJO is in a strong upside trend.  Today, XJO was up +1.26% despite a lack lustre lead from the U.S. last night.


XJO jumped up this morning away from its recent short-term consolidation.  It finished well above its 50-Day MA.  

The three Supertrend lines are all strongly bullish.

After such a strong day we might see some settling back tomorrow.  

Next resistance level is at 7365, support at 7226.  XJO finished today at 7310.

Both DZ Stochastic and RSI confirm the uptrend.  RSI is at 62.32 - so there's more room to move before it gets into overbought territory.

Until otherwise indicated stay with the trend.

Stay safe.

Monday, April 10, 2023

Finspiration Australia.

 11/3/23.  Tuesday Morning Finspiration Report.

U.S. up modestly.


Dow Jones +0.3%.  SP500 +0.1%.  Nasdaq flat -0.03%.  Small Caps +1.2%.  Banks +0.82%.

SP500.


SP500 is in a sideways consolidation.  The medium term trend remains up.  

The past two days show intra-day buying.

Stay with the up-trend.

Commodities.


Commodities Index flat +0.00%.  Energy flat +0.09%.  Base Metals -0.51%.  Agriculture +0.24%.  Gold -0.74%.

Although Base Metals finished to the down-side, there was a lot of intra-day buying which augurs well for our miners today.

Bitcoin.

BTC has a big rise last night, up +4.64% and has broken upwards from its long side-ways consolidation.

The crypto remains in an up-trend.  Stay with the trend.

Tuesday, April 4, 2023

Finspiration Australia.

 4/4/23.  Tuesday Evening Finspiration Report.

Reserve Bank Interest Rate Day - A Fizzer?


XJO finished higher today - up just +0.18%.

Interest Rate Day often produces some sharp movements in the market - but not today.  After the "No Change" announcement, XJO did move higher but not much, up 14 points or +0.19%.  That's not a lot compared to what it can do on IRD.

Notice how the XJO moved up in the five minutes before the interest rate announcement.  Somebody (or somebodies) seems to have pre-empted the IR announcement.  I suspect it occurred while there was some unseen selling going on in the background - two bob each way.  If it goes down, the punter/s exits the buy side and let the sell side cascade down.  If it goes up - exit the sell side and enjoy the ride.  Remember that HFT Algorithms react in a milli-second, and large institutions act within one second.  No retail trader can hope to compete in these sudden changes in direction.

Nine out of eleven sectors were up today.  A big hit was taken by XMJ (Materials), down -0.9%.  BHP, the largest stock in that sector, was down -2.2% today.

Best sector was Energy, up +1.3%.  It got a push higher from oil price rises overnight - as a result of cuts by OPEC to their output.

Here's the XMJ Chart:

XMJ finished the day below the Short-Term Line (3-DEMA) but remains above the 8DEMA (dashed line).  A finish below that would be short-term bearish.


Monday, April 3, 2023

Inspiration Australia.

4/4/23. Tuesday Morning Finspiration Report. 

Overnight in the U.S.:  Dow Up, Nasdaq down.  Oil up.


Dow Jones +0.96%.  SP500 +0.37%.  Nasdaq -0.27%.  Small Caps +0.05%.  Banks -0.55%.

SP500.


SP500 remains bullish but somewhat extended to the upside.  Dips will probably be bought.

Stay with the trend.

Nasdaq.


Nasdaq had a small pull-back last night at a major resistance level.  MACD is showing a big negative divergence from the chart.  Expect some downside to the Nasdaq in the near term.

Commodities.


Commodities Index +1.64%.  Energy +3.24%.  Base Metals -0.89%.  Agriculture +0.1%.  Gold +0.72%.

After ten minutes of trading this morning, XJO is is flat +0.07%.

Bitcoin (USD)


A wide double top may be forming in BTCUSD.  

Indicators (lower panels) are all heading down.  

The short-term line is headed down.  The Crypto finished last night below the 8-Day EMA.

All that suggests more downside if the current horizontal support breaks.  Take care.


Saturday, April 1, 2023

    2/4/23.  Weekend Report - The Week That Was.  Week Ended 31/3/23.

XJO Monthly Chart.


The month of March finished with a flurry.  After being solidly down for three weeks, the final week of the month brought a rally.  XJO finished -1.11% for the month, but the long lower wick on this month's candle shows the extent of the rally in the past week.

The index finished above the 8-Month EMA.  Supertrend remains bullish and Hull MA13 remains bullish.  
  
Dynamic Zone Stochastic is on a "buy" signal from Dec. 22 and DZ RSI is on a "buy" signals from Nov. 22.  (These signals are advisory only, and can give false signals.)

XJO Weekly Chart.


XJO finished the week above its 50-Week MA (equiv. to 250-Day MA), and has bounced off support at the 6900 level (round figures).  

The last three candles are in a bullish configuration:  big down week, doji, big up week.

This week, the chart finished marginally above the 8-Week EMA but remains below the Supertrend and Hull MA13 remains bearish.  So, the market is not out of the woods yet.

DZ Stochastic still hasn't given a weekly "buy" signal.  DZ RSI has given a "buy" signal this week, that follows its "sell" signal back in early February.


XJO Daily Chart.


This week, XJO is up every day of the week.  It has finished above the 200-DMA and 8-DEMA. Supertrend is bullish and Hull MA13 is bullish.

Now for a cautionary note.  DZ Stochastic and DZ RSI are both in over-bought conditions.  A down-turn below the upper zones would be a short-term "sell" signal.  

Monthly and Daily Charts are in sync (bullish).  Weekly Chart is still a little hesitant with DZ Stochastic still not showing a "buy" signal, but DZ RSI is bullish.


Weekly Changes in Sectors.


All eleven sectors (plus Gold Miners) were positive this week.  This week's rally was broad based.  

Composite Bonds (a safe haven) saw it lose a little ground, down -0.39%.

Best sector, by far, was XMJ (Materials) up a massive +7.01%.  XXJ (Financials), the largest sector in the market, was up strongly, +2.49%.  The two weakest sectors (relatively) were XHJ (Health) +1.08% and XPJ (Property) +1.02%.  

Sector Momentum.


The above chart shows Monthly, Weekly and Daily RSI's for eleven sectors plus Gold Miners and Composite Bonds.

All three columns sloping up - bullish trend.  XDJ, XIJ, XTJ, XSJ, XNJ, XGD, IAF.
All three columns sloping down - bearish trend.  XPJ
Down then up - counter trend bullish rally.  XXJ, XMJ, XEJ, XHJ, XUJ.
Up then down - counter trend bearish rally.  No sectors.

This is a picture of a very strong market with only one sector showing bearish momentum - Property.

All other sectors, plus Gold Miners and Composite Bonds (IAF) are either in a bullish trend or a bullish counter trend rally.

NewHighs-NewLows.

This is a long-term indicator, but a good guide for long-term investors.


NH-NL Cumulative started falling on 9 Feb.  It has remained below its 10-Day MA since 13 February.  On Friday, it had its first up day since 9 Feb.

Until this (blue line) gets back above its 10-Day MA , it's best for long-term investors to stay defensive.

A momentum chart for NewHighs-NewLows provides a more bullish picture:


This chart shows that the difference between New Highs and New Lows has been narrow since 21 March. The 5-Day MA crosses above the 21-DMA on 22 March - which provides a "buy"signal.  

X-Overs of the 5DMA of the 21DMA have provided good medium term "buy" and "sell" signals.


% of Stocks above key moving averages.

1.  % of stocks above 10-Day Moving Average: Last Week 28%, This Week 77%.  
2.  % of stocks above 50-Day Moving Average, Last Week 29%, This Week 40%.  
3.  % of stocks above 200-Day Moving Average, Last Week 44%, This Week 50%.

Stocks above the 10-Day MA showed a solid improvement this week, it is now well into bullish territory.


Conclusion.
 
This week, the ASX was up breaking a series of seven down weeks in a row.  This week's rise was emphatic and suggests a phase shift in the market from bearish to bullish.  

Stay safe.


Friday, March 24, 2023

Finspiration Australia.

 25/3/23.  Saturday Finspiration Report.

Yesterday - XJO down marginally after strong intra-day buying.

Last night - U.S. stocks finish positive.

XJO Friday:

XJO down -0.2% yesterday.  The long lower wick on yesterday's candle indicates strong intra-day buying.

The only positive on the chart is the Hull MA13 which is the shortest MA I use.  

XJO remains below the 200-Day MA.  It has been rejected by the 10-Day MA and the first line of the triple Supertrends.  We need to see better than that to enter for a trade.

Overnight in the U.S.  Major indices finish up modestly.  Regional Banks have a big rise.


Dow Jones +0.41%.  SP500 +0.56%.  Nasdaq +0.31%.  Small Caps +1.07%.  Regional Banks +3.03%.  Despite that big rise in Region Banks, the chart remains mired at the low end of its big down-trend.
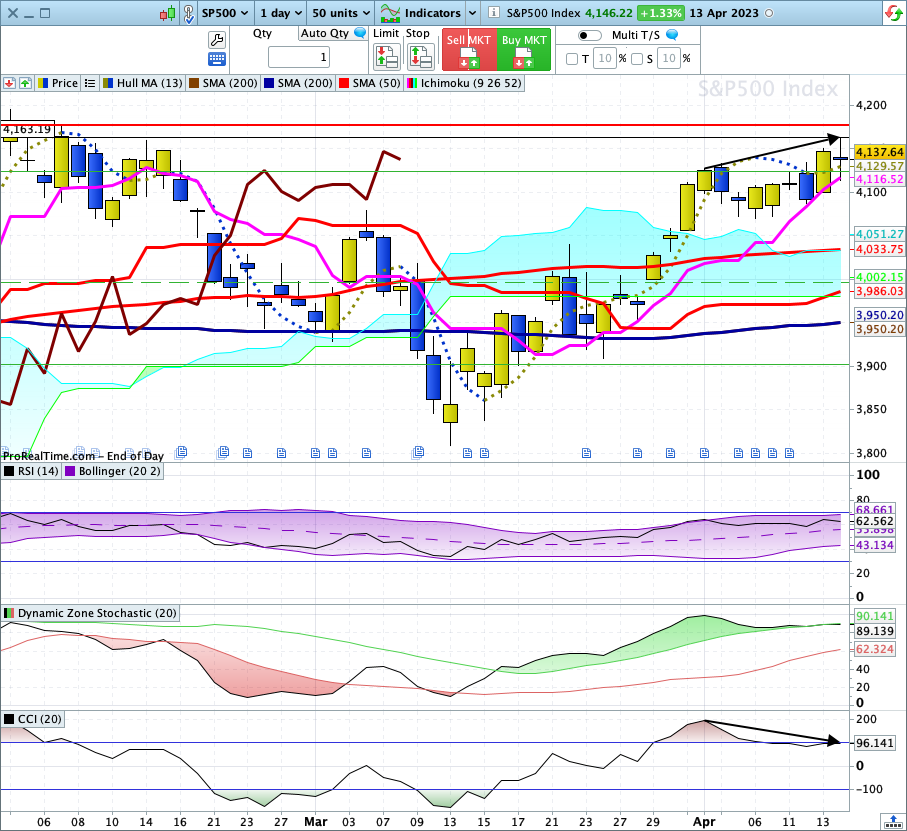
SP500.


SP500 is doing better than Australia's XJO.  It finished last night above its 200-Day MA and above all three of the triple Supertrends.  

Hull MA13 is positive and the Index finished above the 10-Day MA.

The index remains locked between the 50-Day MA and the 200-Day MA.  A move above the 50-Day MA would be bullish.

Commodities.


Commodities Index +0.48%.  Energy +0.2%.  Base Metals flat -0.05%.  Agriculture +1.53%.  Gold -1.13%.

The upside movements in the American Indices suggest that the Australian market will be up on Monday.

Bitcoin.


Overnight, Bitcoin was down -2.41%.  The Hull MA13 has turned down which is a short-term negative signal.

Longer term, BTC remains bullish - above the 10-Day MA and triple Supertrends.


Wednesday, March 22, 2023

Finspiration Australia.

23/3/23.  Finspiration Thursday Bitcoin Report.


 Bitcoin fell -2.73% last night but remains above key support levels.  The trend remains up.  Stay with the trend.

Finspiration Australia. 14/11/23. Tues. Morning Report.

Mixed Results in New York.  Energy up. NAB ex-dividend today. Dow Jones +0.16%.  SP500 -0.08%.  Nasdaq -0.11%.  Small Caps -0.07%.  Banks -0...