Showing posts with label Gold.. Show all posts

Friday, June 23, 2023

24/6/23. Saturday Finspiration Report.

 Friday - felt like Armageddon.  XJO down,  Dow down, Nasdaq down, Europe down, Commodities down.

Armageddon - that is - if you're a normal person - but those dark villains on the "short" side (and I'm not talking about Friends of Snow White or Santa's Little Helpers) were chugging Dom Perignon out of crystal slippers previously worn by Princess Beatrice, who is by now sleeping rough in Piccadilly Circus.

XJO down -1.34%.

That takes the XJO down to just below the 200-Day MA - where it's been a couple of times recently - and then recovered.  

Well - anything is possible in this crazy stock market world, but this looks very different from those two previous efforts of flirting with the 200-Day MA.  

In the U.S. last night:


Dow Jones -0.65%.  SP500 -0.77%.  Nasdaq -1.01%.  Mid Caps -1.16%.  Small Caps -1.65%.  Banks -1.08%.

SP500.


SP500 is nowhere near as dire as the XJO.  It is way above the 200-Day MA.

As I've noted in the past, XJO decoupled from the American market a long time ago - that's due to the out-sized influence of Technology on the U.S. market - whereas, the Australian Tech sector has a small impact on our market.  The Oz market is more influenced by the resources sector which depend on China and Japan for markets.

Still, SP500 is showing weekness.  The three indicators in the lower panels are all on sell signals.

Two out of three super-trend lines have turned bearish.  But, the SP500 is back to the mid-line of the Andrew's Pitchfork, which suggests it might find support at that level.  We shall see.

Commodities.

Commodities Index -1.08%.  Energy -0.26%.  Base Metals -1.96%.  Agriculture -1.91%.  Gold +0.28%.

Those Energy and Base Metals prices provide little joy for our resources sectors.

In Sydney, SFE Futures for ASX200 is down -0.23%, which suggests a weak opening on Monday.


Saturday, May 20, 2023

Finspiration Australia


 Sunday, 21 May, Weekly Report. Australian Market.

The week started poorly but the past couple of days saw an improvement as a "miracle" in the American debt ceiling talks seemed probable.
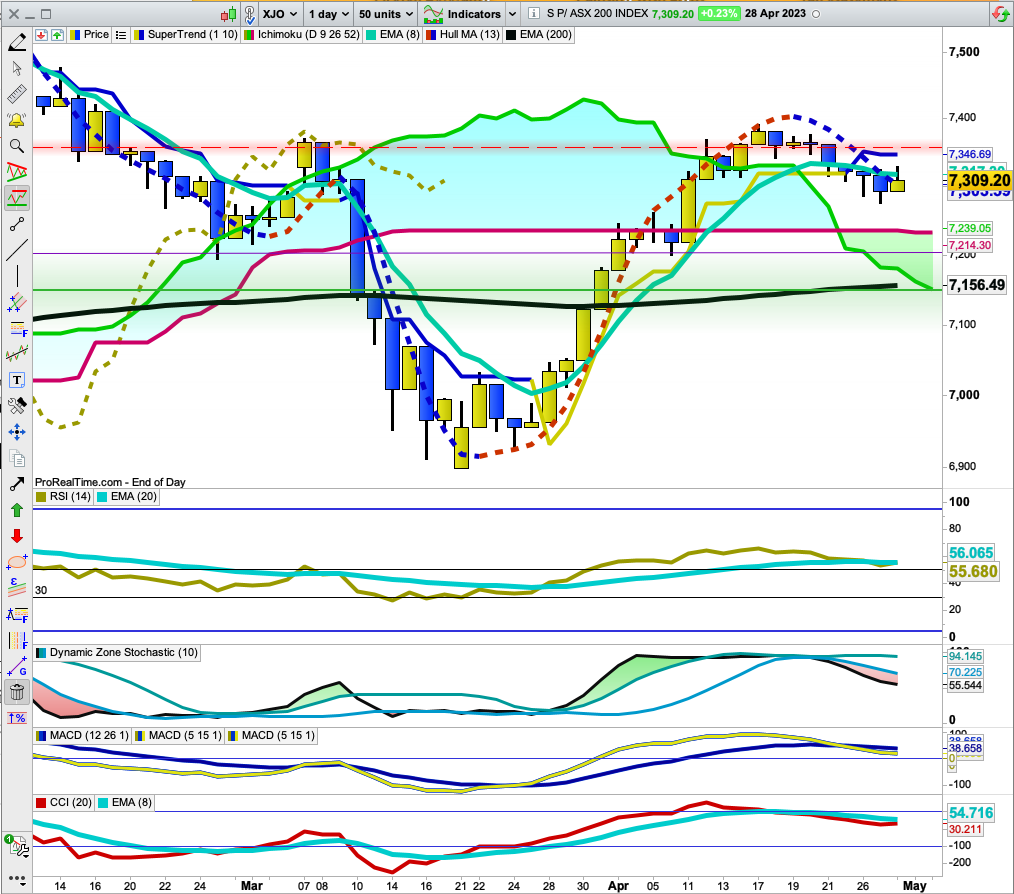
XJO Daily.


XJO finished up a moderate +0.31% for the week but remains in a sideways consolidation movement.

Weekly Performance of Sectors (plus Gold Miners, XJO and Bonds)


Five sectors up, five sectors down and one flat.  Information Technology +5.19% continued its good work from the previous week when it was up +1.97%.  XEJ, which can be quite volatile, was up +1.6% after being flat the previous week. 

The main defensive sectors suffered again this week.  XHJ down -0.69%, XSJ -1.08%, Utilities -0.22%.  Investors seem to be positioned for a risk-on market with a move out of defensives. 

Morningstar classifies the sectors into three groups, 

  • Cyclicals - XMJ, XDJ, XXJ, XPJ.  These have strong correlations to the business cycle.  
  • Sensitive - XTJ, XEJ, XNJ, XIJ.  These have moderate correlations to the business cycle.
  • Defensives - XHJ, XUJ, XSJ.  These tend to have low correlations to the business cycle.

    The "Sensitive" group did well this week with three sectors up and one flat.  XIJ was the best performing sector, followed by XEJ, while XTJ was the fourth best performer.  So three out of the four best performers this week came from the Sensitive group  

    Momentum

    The following data is a medium term measure of momentum obtained by subtracting Weekly RSI from Daily RSI.

    The only sectors with positive upside momentum are Property (XPJ), Energy (XEJ), Telecomms (XTJ) and Information Technology (XIJ). 

    XIJ has continued its dominance this week.  The sector is getting a little long in the tooth - if you hold strong stocks in that sector -  good for you.  It's probably too late now for non-holders to go chasing those stocks (e.g. XRO, WTC).

    Besides XIJ, the big improvers this week were Energy (XEJ) and Financials (XXJ).  Strong stocks in those sectors might be worth a look in the next week. 
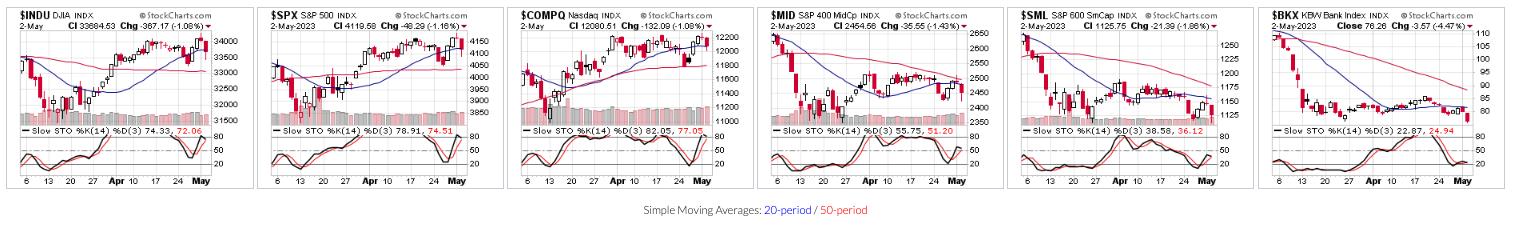
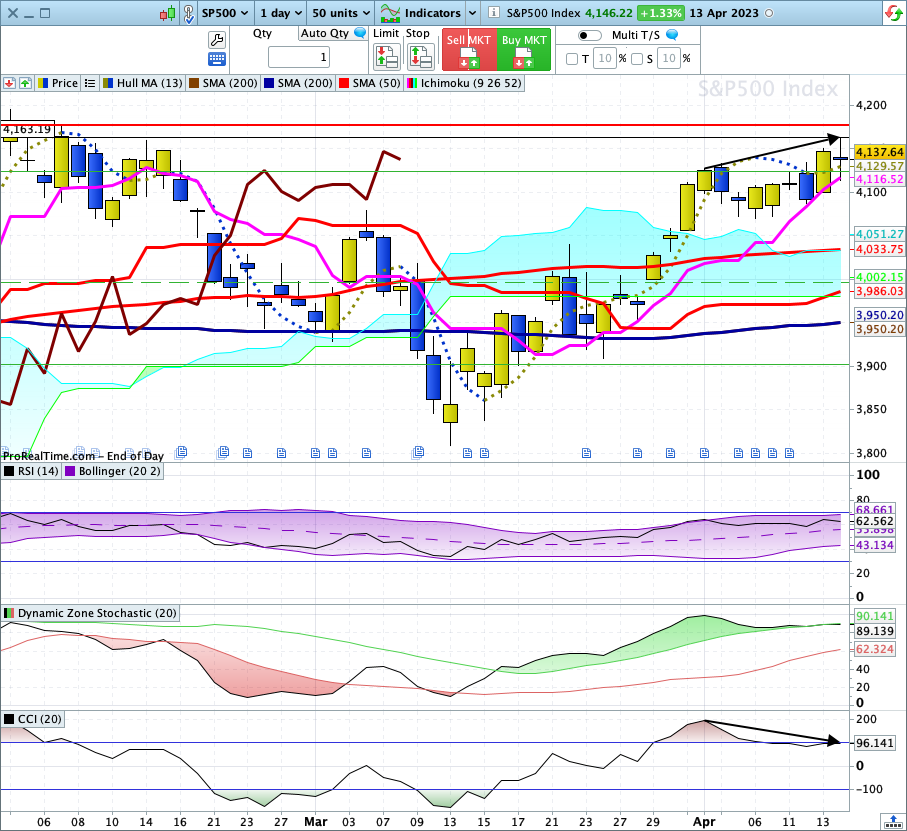
    SP500 Daily Chart.


    SP500 had a strong week this week with hopes that a solution to the Debt Ceiling impasse was probable.  SP500 was up +1.65% this week with most of that coming on Wednesday and Thursday (NY time).

    The Index is in an Upsloping Bearish Wedge.  In my experience, these have a high probability of breaking to the down-side.

    Yesterday, in my Saturday blog, I mentioned that the current up-trend could be a "sucker rally" hasNYSE and Nasdaq breadth hasn't improved in the same way as the Index.

    That adds to the probability that the upscoping wedge will break to the down-side.

    Take care.  If a debt ceiling agreement is reached - it might be a case of "sell the fact".

    Stocks/Bonda Ratio.


    The Stocks/Bonds Ratio Chart has climbed above the zero line so Stocks are currently out-performing Bonds - risk-on.  But,  it is usually best to wait until the 5-Day MA breaks above the 21-Day MA before feeling comfortable about a medium term rally in stocks. 


    Conclusion.

    XJO remains in a sideways consolidation.  Investors appear to be positioning for a risk-on market, with cycling out of Defensives Sectors and into Sensitive Sectors, and, to a lesser extent, into Cyclical Sectors.

    SP500 may be setting up for a move to the downside after a strong week after improving Debt Ceiling talks.  If SP500 does drop, we will probably follow and could break to the downside of the current consolidation.

    Stay safe.

    Tuesday, May 2, 2023

    Finspiration Australia.

     3/4/23.  Wednesday Morning Finspiration Report.

    U.S. declines with banks and energy leading to the downside.


    Dow Jones -1.08%.  SP500 -1.1%.  Nasdaq -1.08%.  Mid Caps -1.43%.  Small Caps -1.9%.  Banks -4.47%.

    SP500.


    Monday's doji candle stick evolved into Tuesday's bearish candle stock.  

    Short-term the SP500 is bearish.  It looks like the big punters are betting on an unfavourable result from the Fed meeting due tonight (Ox time).  The market expects a small rise in the Fed's interest rate - guidance is debatable - but Tuesday's action is looking pessimistic.

    Commodities.

    Commodities Index -2.27%.  Energy -4.22%.  Base Metals -1.76%.  Agriculture -0.92%.  Gold +1.93%.

    After ten minutes of trading, XJO is down -0.6%.

    Saturday, April 29, 2023

    Finspiration Australia

           30/4/23.  Weekend Report -Week Ended 14/3523.

    The Australian market eased back this week with the XJO down -0.29%.  In America, their market was strong.  Dow Jones up +0.86%.  SP500 +0.87%.  Nasdaq +1.88%.  Why?  Simple.  This past week saw some of the big American tech companies report (e.g. META, Amazon, Microsoft, Alphabet).  Their reports were received enthusiastically.  Australia, unlike America, doesn't have a big tech sector in its market, so we didn't follow the Americans to the upside.

    OK - Let's get into it.

    Long-Term View.  XJO Monthly Chart.


    In April,XJO finished up +1.83%.  

    The index finished above its 8-Month EMA.  Hull MA13 is bullish and Supertrend (10/1) is bullish.

    RSI is above 50 - bullish.

    DZ Stochastic is above its buy line, but turned down just a little.

    Double MACD is trending sideways.

    On Balance, the XJO finished bullish for the month.

    Medium-Term View - XJO Weekly Chart.


    XJO lost a little ground in the past two weeks (-0.48% and -0.29% after a strong second week (up +1.98%). 

    RSI is its 20-Day MA - that's bullish.  DZ stochastic remains bullish but into its overbought zone.

    The chart finished above its 8-Week EMA.  Hull MA13 remains bullish and Supertrend (10,1) is bullish.

    Again, the only blemish on the chart is the Double MACD which hasn't had a positive cross-over.  It tends to lag bit.


    Short-term View - XJO Daily Chart.


    The short-term view turned bearish this week.  The index was under pressure the previous week when Hull MA13 turned down.  This week, the chart finished below its 8-Day EMA, Supertrend turned bearish and Hull MA13 remained bearish.  

    RSI finished below its 20-Day MA and DZ Stochastic has given a sell signal.  Double MACD has had a bearish x-0ver and CCI has closed below its 8-Day EMA.

    With both Weekly and Monthly charts both bullish - we are probably looking at a short-term pull-back in the ASX.  Wait to see if this turns bullish before re-entry.

    Daily Chart with Standard Error Channel.

    XJO shows at the bottom edge of the Standard Error Channel.  This is a statistical representation of normal distribution of an Index or Stock.  As XJO is at the lower edge - we can expect a move back up to the upside.  It won't necessarily happen - but the probability is high.

    SP500 Daily


    SP500 has turned bullish - and that will probably drag the XJO back into bullish territory.

    Weekly Changes in Sectors.


    This week, ups and downs in the sectors were fairly even with a slight lean to the bearish side.

    Four sectors were clearly up,  Property +2.07%m Telecommunications Services +1.7%, Information Technology +1.07%, Industrials +0.42%.  Financials finished just marginally on the positive side, +0.02%.

    Five sectors were clearly down.  Materials -1.68%,  Utilities -0.95%, Health -0.58%, Energy -0.48%.  Discretionary fell marginally on the negative side, -004%.

    Financials make up 25.8% of the ASX, Materials make up 23.6%.  Almost half the ASX is made up of those two sectors.  Extreme weakness in one or the other means the ASX will fall.  That happened this week with Materials down -1.68% while Financials was flat.


    Sector Momentum.


    All three columns sloping up - bullish trend. XIJ, XTJ, XPJ, XNJ.
    All three columns sloping down - bearish trend.  XMJ, XUJ.
    Down then up - counter trend bullish rally.  XXJ, XEJ,
    Up then down - counter trend bearish pull-back.  XDJ, XHJ, XSJ, Gold, Composite Bonds (IAF).

    Daily over-bought Momentum shows up in Telecoms - so it may not pay to go chasing strong stocks in that sector (e.g., Telstra).

    NewHighs-NewLows.

    This is a long-term indicator, but a good guide for long-term investors.


    NH-NL Cumulative is above all its MAs (5,10,21).  This is giving it a positive diversion from the ASX chart.  That's a positive development and suggests more upside in the XJO.


    Stocks/Bonds Ratio.


    The past two weeks have favoured bonds over stocks - the ratio chart is falling.  

    A negative x-over of the 5-Day MA below the 21-Day MA is usually a good sign of a return to bear market conditions.  That hasn't happened yet - but could happen if bonds continue to be favoured over stocks.


    % of Stocks above key moving averages.

    1.  % of stocks above 10-Day Moving Average: Last Week 56%, This Week 46%.  
    2.  % of stocks above 50-Day Moving Average, Last Week 65%, This Week 69%.  
    3.  % of stocks above 200-Day Moving Average, Last Week 68%, This Week 61%.
    4.  % of stocks above Hull MA13, Last week 43%, This Week 42%

    We're seeing a mixed picture this week with long-term indicators remain in bullish territory while the shorter term indicators are in bearish territory.


    The chart for stocks above the 200-Day MA has fallen back below its 5-Week MA but remains above its mid-line (50%).  That's in keeping with the pull-back we've seen so far this past couple of weeks.

    Conclusion.

    The past two weeks appear to be a pull-back in an on-going bullish market.  Watch for a resumption of the short-term upside trend this week.  No guarantees, but the probabilities lie to the upside.


    Friday, April 28, 2023

    Finspiration Australia.

     29/4/23.  Saturday Finspiration Australia.

    Yesterday, ASX up modestly.

    Overnight in the U.S.  Another strong period for stocks.

    XJO.

    On Friday, XJO started well after a strong session on Wall Street but faded just before noon.  The afternoon session saw a little strength, but not enough to push the index back above the 8-Day EMA.

    Indicators remain on sell signals.

    Overnight in America.
    Dow Jones +0.8%,  SP500 +0.83%.  Nasdaq +0.69%.  Mid Caps +0.93%.  Small Caps +1%.  Banks 1.49%

    Nasdaq was up +1.89% for the week which had big tech companies reporting.  SP500 up +0.87%.  Dow Jones up +0.86%.  XJO was down -0.29% for the week.

    SP500.


    SP500 remains bullish after a strong day on Thursday.  

    Indicators are showing negative divergences which may dissipate if further upside is seen.

    Commodities.

    Commodities Index +0.94%.  Energy +1.92%.  Base Metals +0.31%.  Agriculture -0.14%.  Golds flat +0.03%


    Thursday, April 27, 2023

    Finspiration Australia.

     28/4/23.  Friday Morning Finspiration Report.

    Overnight in the U.S.  Stocks up strongly.  Worries about banks went out the door with Tech surging strongly. AMAZON falls 2% after its report coming after the closing bell.


    Dow Jones +1.57%.  SP500 +1.96%.  Nasdaq +2.43%.  Mid Caps +1.53%.  Small Caps +1.52%.  Banks +1.54%.

    SP500


    That's a big bullish candle on the SP500 and the index finished above the 8-DEMA and Supertrend turned bullish.  Those are usually reliable early buy signals.  But anything can happen in reporting season.

    Amazon is down in extended trading after hours.  SNAP is now down -17% and Pinterest down -13%.  Tread warily.

    Commodities.


    Commodities Index +0.13%.  Energy +0.09%.  Base Metals +0.37%.  Agriculture -0.19%.  Gold +0.01%.

    BHP up +1.2% overnight in New York.  Rio up +1.21%.

    Overnight Oz Futures are up +0.75%, so we should have a good start to today's trading in Australia.


    Tuesday, April 25, 2023

    Finspiration Australia

    26/4/23.  Wednesday Morning Finspiration Report. 

    Overnight in the U.S.  Stocks finish well down.


    Dow Jones -1.02%.  SP500 -1.59%.  Nasdaq -1.96%.  Mid Caps -1.93%.  Small Caps -2.59%.  Banks -3.45%.

    SP500.


    Three doji candlesticks followed by a big down candle?  Indecision resolved.

    All indicators are now bearish.  Wait for the down-trend to finish.

    Commodities.


    Commodities Index -1.42%.  Energy -2.82%.  Base Metals -2.42%. Agriculture +0.33%.  Gold +0.61%.

    After 20 minutes of trading this morning, XJO is down -0.49%.  Big miners are taking the brunt of the bearish conditions.

    In after market news in the U.S., Microsoft and Alphabet reported.  Both beat expectations.  That should flow on to the Oz market today, although - probably not enough to turn it positive.


    Monday, April 24, 2023

    Finspiration Australia

     25/4/23.  Tuesday Morning Finspiration Report.

    Yesterday in Australia, XJO down marginally.

    Overnight in the U.S., muted market with mixed results.

    XJO Chart.


    XJO has now triggered many short-term "sell" signals.  

    • Hull MA13 has switched from up to down.  (Dashed line on the chart.)
    • RSI has fallen below the mid-line (20-Day MA) of its Bollinger Bands.
    • DZ Stochastic has its bands squeezed together and the Stock line has fallen to the downside.
    • Short-term line of Double MACD has fallen below its long-term line.
    • CCI has fallen below its 8-Day EMA.
    • Chart has fallen below its 8-Day EMA.
    Triple Supertrend lines still haven't switched from yellow to blue - that's a more of a medium-term signal.

    U.S. Indices overnight.

    Dow Jones +0.2%.  SP500 +0.09%.  Nasdaq -0.29%.  Mid Caps +0.02%.  Small Caps -0.01%.  Banks -0.41%.

    SP500.

    Sp500 is showing similar short-term sell signals to the Australian XJO.  Triple Supertrends continue to show bullish - this is more of a medium-term indicator.

    SP500 is showing three doji candle-sticks in a row - indecision.  America is in the midst of Earnings Season - later this week some of the biggest Tech Companies report, e.g., Alphabet, Microsoft, Amazon and Meta.

    The American market is in indecision mode waiting on those ginormous companies to report.

    Other big U.S. companies reporting this week are:  Visa, Pepsi, McDonald's, Boeing, Intel, Mastercard, Exxon, Chevron, Colgate Palmolive.  So it's a big week for reporting in the U.S. this week.  This will have an effect on the direction of the market.

    Next week, the Federal Reserve reports on its interest rate decision.  That's another overhang on the market.

    Commodities.

    Commodities Index +0.8%.  Energy +1.6%.  Base Metals -0.72%.  Agriculture +0.57%.  Gold +0.37%.

    The Australian Market is closed for Anzac Day today.


    Wednesday, April 19, 2023

    Finspiration Australia

     20/4/23.  Thursday Morning Finspiration Report.

    Overnight in the U.S.  Little change in the U.S. again last night.


    Dow Jones -0.23%.  SP500 -0.01%.  Nasdaq +0.03%.  Mid Caps +0.18%.  Small Caps +0.31%.  Banks +1.6%.

    SP500.


    SP500 remains above the 8-Day EMA and Supertrend (10/1).

    DZ Stochastic and Double MACD have given marginal sell signals, but not confirmed by RSI.

    Commodities.

    Commodities Index -1.39%.  Energy -1.71%.  Base Metals -0.6%.  Agriculture -0.89%.  Gold -0.48%.

    Yesterday in Australia we had a flat day with Miners up and Banks down.  Today it seems we'll have another flat day but relative strength reversed, Banks up and Miners down.


    Tuesday, April 18, 2023

    Finspirtion Australia.

     19/4/23.  Wednesday Morning Finspiration Report.

    Overnight:  US finishes with little change.


    Dow Jones -0.03%.  SP500 +0.09%.  Nasdaq -0.04%.  Mid Caps -0.13%.  Small Caps -0.53%.  Banks+0.17%.

    SP500.

    SP500 is close to a major horizontal resistance level.  

    The chart is in a bearish upscoping wedge which usually breaks to the downside.

    Continue to watch for a downside break.

    Commodities.


    Commodities Index +0.21%.  Energy -0.35%.  Base Metals +1.11%.  Agriculture +0.47%.  Gold +0.39%.

    After 30 minutes of trading this morning,  XJO is up +0.1% in choppy trading.  Miners are strong, banks are weak.

    Bitcoin.

    BTCUSD was up strongly last night, +3.21%.  Technically, bearish conditions continue to exist.

    MACD shows a negative double divergence.  Supertrend remains bearish and Hull MA13 is turned down.

    Monday's downside move could be a one-off - but until indicators turn bullish - I'll stick with my original analysis.


    Monday, April 17, 2023

    Finspiration Australia

     18/4/23.  Tuesday Morning Finspiration Report.

    Modest gains in the U.S. overnight.


    Dow Jones +0.3%.  SP500 +0.33%.  Nasdaq +0.28%.  Mid Caps +0.76%.  Small Caps +0.59%.  Banks +1.4%.

    SP500.


    The up-trend in the SP500 remains bullish.

    DZ Stochastic continues to flirt with its "sell" line - last night it lifted just above the upper line of its Dynamic Zones.  RSI remains clear of its "sell" line - the 20-Day MA.  Both must confirm

    Commodities.


    Commodities Index -0.41%.  Energy -1%.  Base Metals -0.55%.  Agriculture +1.39%.  Gold -0.45%.

    ASX Futures down -0.2% - that suggests the Oz market will have a weak opening.

    Bitcoin.


    Bitcoin was down heavily overnight, -2.88%.

    Lots of bearish signals:
    • Three doji candlesticks in a row (lots of indecision) followed by a big bearish candle (indecision eradicated).  
    • Last night also fell below a major support/resistance line set back in May 2022.
    • The first Supertrend line has turned bearish.
    • Last night's candle fell below the 8-Day EMA.
    • RSI has fallen below its mid-line (20-Day MA).  That's a sell signal.
    • Dynamic Zone Stochastic has confirmed the RSI sell signal by falling below the upper line of the Dynamic Zones.
    Stay Safe.


    Friday, April 14, 2023

    Finspiration Australia.

    15/4/23.  Saturday Finspiration Report. 

    XJO up on Friday.  Dow Jones down on Friday night.


    XJO, after starting on the down-side on Friday, finished on the high-side, up +0.51%.  It remains stalled at horizontal resistance where it's been for the past three days.

    The trend remains up - so stay with the trend until we see definite signs of a pull-back.

    Overnight in America.

    Dow Jones -0.42%.  SP500 -0.21%.  Nasdaq -0.36%.  Mid Caps -0.52%.  Small Caps -0.79%.  Banks +1.09%.

    SP500.


    Last night's candle was a "doji" indicating indecision.

    SP500 is stalling at horizontal resistance and CCI is showing negative divergence.

    DZ Stochastic has marginally broken below its upper Zone line - the first suggestion of a "sell" signal.  This needs confirmation by a move by RSI below its middle line - its 20-Day MA.

    Commodities.


    Not much movement in Commodities except for Gold.

    Commodities Index +0.12%.  Energy +0.09%.  Base Metals +0.1%.  Agriculture +0.19%.  Gold -1.77%.

    The Gold chart has left and "evening star" doji candle-stick from Thursday night.  That's often a sign of a pull-back.  But the chart has been left sitting on the 20-Day MA - so it could bounce here.

    Overnight in the U.S., BHP was down -1.79% and Rio was down -1.89%.

    Bitcoin.

    Bitcoin in USD was up +0.63% last night and remains bullish.

    (I don't have an up-to-date chart yet, but will put one up when it becomes availble.)


    Finspiration Australia. 14/11/23. Tues. Morning Report.

    Mixed Results in New York.  Energy up. NAB ex-dividend today. Dow Jones +0.16%.  SP500 -0.08%.  Nasdaq -0.11%.  Small Caps -0.07%.  Banks -0...