Showing posts with label NeHighs-NewLows. Show all posts

Saturday, April 29, 2023

Finspiration Australia

       30/4/23.  Weekend Report -Week Ended 14/3523.

The Australian market eased back this week with the XJO down -0.29%.  In America, their market was strong.  Dow Jones up +0.86%.  SP500 +0.87%.  Nasdaq +1.88%.  Why?  Simple.  This past week saw some of the big American tech companies report (e.g. META, Amazon, Microsoft, Alphabet).  Their reports were received enthusiastically.  Australia, unlike America, doesn't have a big tech sector in its market, so we didn't follow the Americans to the upside.

OK - Let's get into it.

Long-Term View.  XJO Monthly Chart.


In April,XJO finished up +1.83%.  

The index finished above its 8-Month EMA.  Hull MA13 is bullish and Supertrend (10/1) is bullish.

RSI is above 50 - bullish.

DZ Stochastic is above its buy line, but turned down just a little.

Double MACD is trending sideways.

On Balance, the XJO finished bullish for the month.

Medium-Term View - XJO Weekly Chart.


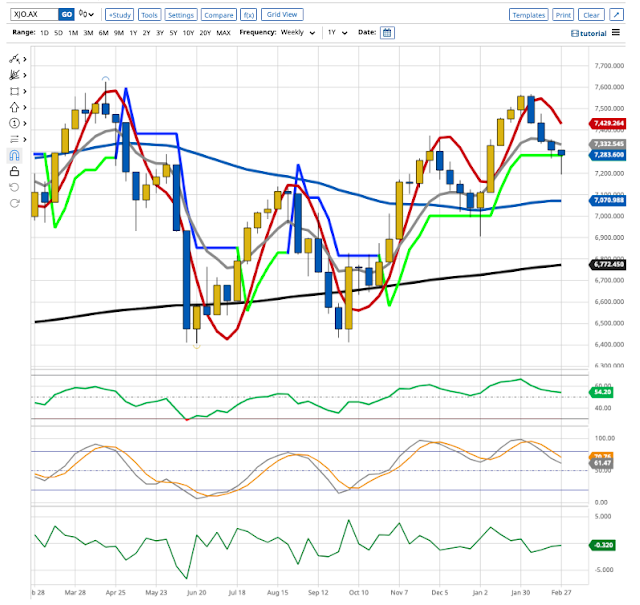
XJO lost a little ground in the past two weeks (-0.48% and -0.29% after a strong second week (up +1.98%). 

RSI is its 20-Day MA - that's bullish.  DZ stochastic remains bullish but into its overbought zone.

The chart finished above its 8-Week EMA.  Hull MA13 remains bullish and Supertrend (10,1) is bullish.

Again, the only blemish on the chart is the Double MACD which hasn't had a positive cross-over.  It tends to lag bit.


Short-term View - XJO Daily Chart.


The short-term view turned bearish this week.  The index was under pressure the previous week when Hull MA13 turned down.  This week, the chart finished below its 8-Day EMA, Supertrend turned bearish and Hull MA13 remained bearish.  

RSI finished below its 20-Day MA and DZ Stochastic has given a sell signal.  Double MACD has had a bearish x-0ver and CCI has closed below its 8-Day EMA.

With both Weekly and Monthly charts both bullish - we are probably looking at a short-term pull-back in the ASX.  Wait to see if this turns bullish before re-entry.

Daily Chart with Standard Error Channel.

XJO shows at the bottom edge of the Standard Error Channel.  This is a statistical representation of normal distribution of an Index or Stock.  As XJO is at the lower edge - we can expect a move back up to the upside.  It won't necessarily happen - but the probability is high.

SP500 Daily


SP500 has turned bullish - and that will probably drag the XJO back into bullish territory.

Weekly Changes in Sectors.


This week, ups and downs in the sectors were fairly even with a slight lean to the bearish side.

Four sectors were clearly up,  Property +2.07%m Telecommunications Services +1.7%, Information Technology +1.07%, Industrials +0.42%.  Financials finished just marginally on the positive side, +0.02%.

Five sectors were clearly down.  Materials -1.68%,  Utilities -0.95%, Health -0.58%, Energy -0.48%.  Discretionary fell marginally on the negative side, -004%.

Financials make up 25.8% of the ASX, Materials make up 23.6%.  Almost half the ASX is made up of those two sectors.  Extreme weakness in one or the other means the ASX will fall.  That happened this week with Materials down -1.68% while Financials was flat.


Sector Momentum.


All three columns sloping up - bullish trend. XIJ, XTJ, XPJ, XNJ.
All three columns sloping down - bearish trend.  XMJ, XUJ.
Down then up - counter trend bullish rally.  XXJ, XEJ,
Up then down - counter trend bearish pull-back.  XDJ, XHJ, XSJ, Gold, Composite Bonds (IAF).

Daily over-bought Momentum shows up in Telecoms - so it may not pay to go chasing strong stocks in that sector (e.g., Telstra).

NewHighs-NewLows.

This is a long-term indicator, but a good guide for long-term investors.


NH-NL Cumulative is above all its MAs (5,10,21).  This is giving it a positive diversion from the ASX chart.  That's a positive development and suggests more upside in the XJO.


Stocks/Bonds Ratio.


The past two weeks have favoured bonds over stocks - the ratio chart is falling.  

A negative x-over of the 5-Day MA below the 21-Day MA is usually a good sign of a return to bear market conditions.  That hasn't happened yet - but could happen if bonds continue to be favoured over stocks.


% of Stocks above key moving averages.

1.  % of stocks above 10-Day Moving Average: Last Week 56%, This Week 46%.  
2.  % of stocks above 50-Day Moving Average, Last Week 65%, This Week 69%.  
3.  % of stocks above 200-Day Moving Average, Last Week 68%, This Week 61%.
4.  % of stocks above Hull MA13, Last week 43%, This Week 42%

We're seeing a mixed picture this week with long-term indicators remain in bullish territory while the shorter term indicators are in bearish territory.


The chart for stocks above the 200-Day MA has fallen back below its 5-Week MA but remains above its mid-line (50%).  That's in keeping with the pull-back we've seen so far this past couple of weeks.

Conclusion.

The past two weeks appear to be a pull-back in an on-going bullish market.  Watch for a resumption of the short-term upside trend this week.  No guarantees, but the probabilities lie to the upside.


Saturday, March 4, 2023

Finspiration Australia.

     5/3/23.  Weekend Report - The Week That Was.  Week Ended 3/3/23.

XJO Monthly Chart.


We've only had three days in March with the XJO up +0.35%.  In February, XJO was down -2.92%

So far, the Index is above the 8-MEMA, Hull MA13, 50-MMA, 200MMA, Supertrend (7/1.5).  Not much damage done yet.
  
Monthly RSI is at 54.31.  50 represents the dividing line between bullish and bearish.

XJO Weekly Chart.


XJO remains in an up-trend, with higher highs and higher lows.  In the past five days, XJO fallen -0.32%.  The previous week it was down -0.54%.  So down side over the past two weeks has been modest.

This week saw good buying during the week to erase most of the early losses.

XJO began to fall four weeks ago at a major resistance level.  

8-Week EMA and Hull MA13 turned turned down, which is bearish. Supertrend continues to provide support this week.  Events overnight on Friday in America could see a break to the upside.   

Weekly RSI is at 54.2 - bullish but falling.  


XJO Daily Chart.


This week, XJO was behind the eight-ball with a big fall on Monday.  It has been up three of the past four days.

My shortest term moving average is the Hull MA13.  It turned down on the 9 Feb.  It has now turned up, so the down-trend could be ending.

I'd like to see the index finish above the 8-Day EMA (grey line) before feeling confident that the short-term trend has turned up.  That seems likely to occur on Monday, given events in the U.S. on Friday night.


Weekly Changes in Sectors.


Breadth was poor this week, with only two sectors pushing to the upside - but those two sectors did extremely well, Energy +5.19% and Materials +3.98%.

Financials, the biggest sector in the ASX, was down heavily -2.88%.  It has been doing very poorly in recent times, but could be coming to the end of its pull-back.


On the Thursday, XXJ fell heavily taking its RSI down to 26.6.  We rarely see the RSI for XXJ get below 30 before we get some sort of a rebound.  Watch XXJ on Monday for some good news for our market.

Gold Miners.

XGD (Gold Miners) was one of the stand-outs this week, up +6.42% after being down five weeks in a row.  The bullish engulfing candle for this week suggests more upside for the Gold Miners.  It has also bounced off support of the 50-Week MA - another bullish sign.


NewHighs-NewLows.

This is a long-term indicator, but a good guide for long-term investors.


NH-NL pulled to the upside this week, with the 3-Day MA rising sharply.  The 3-Day MA needs to get back above the 20-Day MA for long-term investors to feel comfortable about their investments.  Until that happens, stay defensive.

Stocks v Bonds.  Relative performance.


On a relative basis, Bonds are currently outperforming Stocks, i.e., the chart is below the zero level.

This is a reasonable picture of bullish and bearish status of the market.  It's probably a good idea for medium term investors to remain bearish on stocks while this chart remains below zero.  If you're a bit cheeky, you might go long if the chart rises above the 10-Day MA.


% of Stocks above key moving averages.

1.  % of stocks above 10-Day Moving Average: Last Week 44%, This Week 40%.  
2.  % of stocks above 50-Day Moving Average, Last Week 56%, This Week 55%.  
3.  % of stocks above 200-Day Moving Average, Last Week 65%, This Week 61%.

The longer term measures remain above the 50% mark.  So the market is not in bad shape.  Short-term I'd like to see Stocks above 10-DMA move back above 50%.

SP500.

I mentioned, early in this report, the good results in America on Friday.  Here's the SP500 chart.


The past two sessions on the SP500 have seen strong upside moves.    Friday saw a rise of +1.61%.  That triggered a number of bullish indicators.  

Thursday saw the SP500 bounce strongly off the 200-Day MA - that's a bullish indicator.  Friday saw the index cross above the 8-Day EMA, and the Supertrend changed from blue to yellow - bullish.  Hull MA13 has turned up - bullish.

This looks like the start of a good short-term upside rally.
 

Conclusion.
 
A lot of jig-saw pieces are falling into place for our market in the coming week.  SP500 has turned short-term bullish and we should follow suit on Monday.


Saturday, February 25, 2023

Finspiration Australia.

     26/2/23.  Weekend Report - The Week That Was.  Week Ended 24/2/23.

XJO Monthly Chart.


After almost four weeks, XJO down so far -2.27% after stalling at the top of the strong January candle.  XJO has also reached a zone where it has failed in the past.

So far, the Index is above the 8-MEMA, Hull MA13, 50-MMA, 200MMA, Supertrend (7/1.5).  Not much damage done yet.
  
Monthly RSI is at 54.68.  50 represents the dividing line between bullish and bearish.

XJO Weekly Chart.


XJO remains in an up-trend, with higher highs and higher lows.  In the past five days, XJO fallen -0.54%.

XJO began to fall three weeks ago at a major resistance level.  

8-Week EMA and Hull MA13 turned turned down, which is bearish. Supertrend is providing support at this moment.  Events overnight in America could see a break to the downside of Supertrend.

Weekly RSI is at 55.2 - bullish but falling.  

CCI remains above its zero line (but falling).  It's been above its zero line since 24 Oct. 2022.  That marked the start of this bull market.


XJO Daily Chart.


XJO was in a strong up-trend in January.  It is currently in a short-term down-trend.

Daily RSI has fallen below its mid-line of 50.  That's bearish

XJO may be finding support at the 50-Day MA.   As stated previously, events on Friday in America could see a decisive break below that support level.

Weekly Changes in Sectors.

Despite the fall in the XJO this week of -0.54%, breadth was quite healthy.  Only two sectors fell this week, XMJ (Materials) -2.96% and XDJ (Discretionary) -1.23%.  XSJ (Staples) was flat, +0.09%

A couple of sectors showed quite healthy gains, XUJ (Utilities) +6.05% and XPJ (Property) also +6.05%.

The damage to the XJO was mainly done by XMJ (Materials) after both BHP and RIO presented gloomy reports to the market.  That's largely a result of events in China, where the country was in lock-down for the second half of 2022 - the time covered by the reports from BHP and Rio.  (The biggest markets for those two countries are in China.)


Monthly, Weekly and Daily RSIs. - Sectors + XJO + Gold + Composite Bonds.


This week's chart:


Each sector has three bars representing the RSI on Monthly, Weekly and Daily bases.

The following is a rough guide to interpreting the chart.

Bullish:  Rising bars.
Bearish:  Falling bars.
Counter trend rally:  Falling then rising.
Pull-back:  Rising then falling.

Bullish Sectors: XIJ, XNJ.
Bearish Sectors:  XXJ, XMJ, XEJ.
Counter trend Rally:  XUJ, XPJ.
Pull-back:  XDJ, XTJ, XHJ, XSJ.

XJO is in pull-back mode.  Composite Bonds (IAF) and Gold (XGD) are also in pull-back mode.


NewHighs-NewLows.

This is a long-term indicator, but a good guide for long-term investors.


NH-NL have been pulling back since the end of January.  That's a warning sign to long-term investors to stay defensive,

Stocks v Bonds.  Relative performance.

On a relative basis, Bonds are currently outperforming Stocks, i.e., the chart is below the zero level.

This is a reasonable picture of bullish and bearish status of the market.  It's probably a good idea to remain bearish on stocks while this chart remains below zero.


% of Stocks above key moving averages.

1.  % of stocks above 10-Day Moving Average: Last Week 42%, This Week 44%.  
2.  % of stocks above 50-Day Moving Average, Last Week 61%, This Week 56%.  
3.  % of stocks above 200-Day Moving Average, Last Week 70%, This Week 65%.

In the short-term, breadth, as measured by stocks above the 10-Day MA, improved a little this week as indicated by the Sector changes shown above.

The longer term measures remain above the 50% mark.  So the market is not in bad shape.

SP500.

I mentioned early in this report, the poor results in America on Friday.  Here's the SP500 chart.


SP500 began a steep decline six days ago and has fallen five of the past six days.  Friday saw a fall of >1%.  That could result in a follow-on fall in the XJO on Monday.

But a lot of strange things are happening in this chart.  Three of the candles show "hang-man" candles.  A small body at the top of the candle and a very long lower wick.  That indicates plenty of intra-day buying.

Although the bears have been dominant in the past six days, bulls have been fighting good rear-guard actions on three of the days, pushing back against the bulls.

The chart is now down to a crucial level.  It bounced strongly off the 200-Day MA on Friday despite the initial big fall.  Such action could spell the end of this push down by the bears.  We need to see a big upside candle on the SP500 on Monday to be confident that this fall is over - at least in the short-term.

It would be very interesting on Monday if the XJO pre-empts the SP500 by rising, or at least showing good strength in intra-day trading


Conclusion.
 
February has been a poor month for the XJO.  Although the past week showed a net loss for the XJO, internal strength wasn't nearly as pessimistic as suggested by the -0.54% fall in the XJO.

The long-term trend for the XJO is still bullish with higher highs and higher lows. 

Markets here and in the U.S. are now at a crucial stage.  Watch carefully for events on Monday.


Saturday, February 11, 2023

Finspiration Australia

   12/2/23.  Weekend Report - The Week That Was.  Week Ended 10/2/23.

This week has seen a dramatic change in investor sentiment.  The previous week, the market was all gung-ho and seriously overbought.  This week, investors sobered up and a pull-back has started.

XJO Monthly Chart.


We've only had ten days so far in February.  XJO down so far -0.58% stalling at the top of the strong January candle.  XJO has also reached a zone where it has failed in the past.

So far, the Index is above the 10-MMA, Hull MA13, 50-MMA, 200MMA, Supertrend (7/1.5).  Not much damage done yet.
  
Monthly RSI is at 56.57.  50 represents the dividing line between bullish and bearish.

XJO Weekly Chart.


In the past five days, XJO fallen -1.65%.  

The weekly chart shows a bearish engulfing candle.  That's occurred at a major resistance zone.

Candlesticks are a graphic depiction of buying and selling in the market.  A big dark engulfing candle shows the sellers were in complete control of trading this week.

8-Week EMA, Hull MA13 and Supertrend remain in bullish configurations, so not a lot of damage done yet.

Weekly RSI is at 60.58 - bullish but falling.  

Stochastic was showing a negative divergence and has now turned down below its signal line.


XJO Daily Chart.


XJO was in a strong up-trend in January.  That's all changed now.

Daily RSI is now at 53.71 - that's well below the weekly RSI of 60.58.  A fall by the Daily RSI below the Weekly RSI is indicative of a pull-back.  That's not something to trade from - but a filter to alert you to look at the charts and trade the charts.

Daily RSI remains above the bullish level of 50.

The indicator overlays on the chart (8-DEMA, Hull MA and Supertrend) all indicate the dramatic nature of the reversal that's occurred in the XJO.

STW Daily.

XJO can be a bit deceptive on a chart as it always opens at the same level as the previous day's close.  Never any gaps on an XJO chart.

STW is a tracking ETF for the XJO and can often give clues as to investors' thinking not available from the index.

The above chart shows a big gap opening to the down-side on Friday and breaking below key indicators (8-DEMA, Hull MA and Supertrend).  That's a key sign that a trend reversal has occurred.

Of course, the market always tries to play with the minds of investors.  Looking at the right hand side of the chart, an investor might think that further downside is immediately probable.  But looking at the left hand side of the chart shows a key support at 67.08.  STW closed at 67.07 on Friday - so we might get some upside here before another move to the downside.  

Monthly, Weekly and Daily RSIs. - Sectors + XJO + Gold + Composite Bonds.


This week's chart:


In the week prior to this now, five sectors out of eleven were 70 RSI.  Now there are none, with only one sector above 60 - XXJ - but it is also in pull-back mode.   

Bullish sectors with RSIs arranged in ascending order are:  XDJ, XIJ, XSJ.  In the previous week, eight sectors were bullish.  That's a big change in breadth.

Sectors in pull-back mode (Daily RSI falling below Weekly RSI) XXJ, XMJ, XEJ, XTJ, XHJ, XUJ, XPJ and XNJ.  That's eight out of eleven sectors.

Gold (an industry group within XMJ) is in pull-back mode. 

On the daily time-frame, we've switched from eight out of eleven bullish sectors, to eight out of eleven sectors in pull-back mode.


NewHighs-NewLows Cumulative.

This is a long-term lagging indicator, but a good guide for long-term investors.


NH-NL Cum is represented by the blue line.  It is now marginally above the 10-DAY MA but remains well above the 21 and 34 Day Moving Averages.  The Moving Averages are all aligned in bullish fashion from 10DMA at the top, then 21, then 31.  This provides a buffer against pull-backs.

I've developed another long-term metric "StrongStocks-WeakStocks" which is similar to NH-NL but gives signals a little earlier than NH-NL  SS-WS is up for the 13th week in a row and has moved well above its 5-Week MA.   This week there were only 6 Strong Stocks compared to 34 the previous week.  Weak stocks remained at four.   While this remains above its 5-Week MA, long-term investors can remain calm.


% of Stocks above key moving averages.

1.  % of stocks above 10-Day Moving Average: Last Week 67%, This Week 26%.  
2.  % of stocks above 50-Day Moving Average, Last Week 78%, This Week 61%.  
3.  % of stocks above 200-Day Moving Average, Last Week 76%, This Week 71%.  

All metrics have pulled back, but only the shortest time-frame one is showing bearish tendencies.  At this stage, we are seeing a pull-back and nothing more serious.


Stocks above 200-Day MA have fallen from 76% to 71% but remain above the 5-Week MA.


Conclusion.
 
Daily chart of XJO was in a strong uptrend.  That has now reversed to the downside.

STW (ETF for XJO) suggests we could see some consolidation here or some upside in the near term.  

Overall, however, investors' mind-set has now taken a turn for the worse.  Expect more downside before this pull-back is over.


Saturday, June 4, 2022

     Weekly Wrap - Week ending 3 June, 2022.

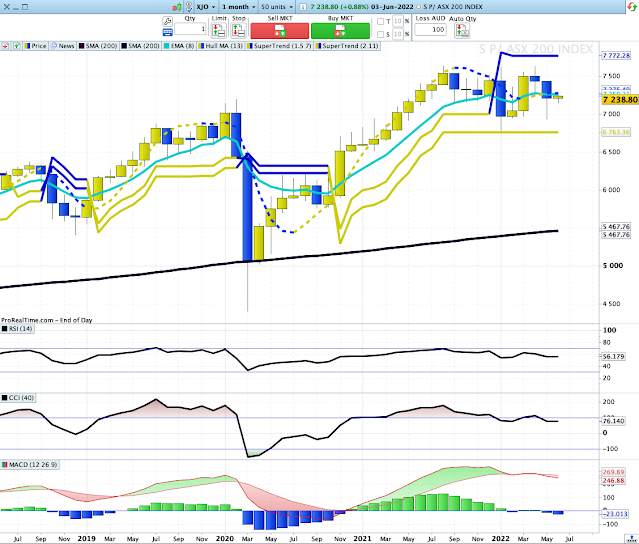
XJO Monthly Chart.


XJO is only three days into a new month (June).

The monthly chart remains range bound 6970-7630.  

The chart is  is essentially sideways as indicated by the two flat Supertrend lines, one above and one below the monthly candles.  

The MACD Histogram also indicates a flat or sideways market, with the Histograms almost non-existent for the past four months - hugging the zero line.

Weekly Chart.


XJO was positive this week, +0.78%.  This is its third week in a row to the upside.

The chart is range bound, in concert with the monthly chart.  

Medium term, the chart remains bearish..  Hull MA13 is blue (bearish); two Supertrend lines are blue (bearish) and the chart is just below the 8-Week EMA (bearish).  RSI and CCI are below their mid-lines (bearish). MACD Histogram is flat - non-trending.

The chart is, however, rising from the lower edge of the range

The chart shows a trading range in round figures from 7630 to 6930.  This week XJO finished at 7239.  

Daily Chart.


The daily chart is in a three-week up-trend, and has broken upside on the Donchian Channel.

Both Supertrend Lines are bullish, Hull MA13 is bullish; Chart is above the 8-DEMA which is bullish.

All of that looks hunky-dory, except - it all might just be a counter-trend rally.  Looming just above are the 50-DMA, 200-DMA and horizontal resistance, all three lined up together.  

To prove its bullish condition, the chart has to surpass those three resistance levels.  Maybe in the coming week?

(Many successful trading strategies use the 200-DMA as a filter.  Take long entries only if the instrument is above the 200-DMA, take short entries only if the instrument is below the 200-DMA.)

Sector Changes - past week.


This chart shows the performance of each sector (plus Gold Miners, XJO, BEAR and IAF) over the past week.  

The Market is relatively well balanced, with five sectors up, two flat and four down.  Resources (Materials XMJ +3.83%. Energy XEJ +3.96%) were largely responsible for the positive ASX return this week.  They remain the two sectors best placed for long trades.

Financials (XXJ -1.3%) is the biggest sector in the market and a major drain on the performance of the XJO this week.

New Highs - New Lows Cumulative.

This is one of the important breadth indicators.  Unless breadth is solidly positive, the market is always under threat.

NH-NL Cumulative continues to fall and is now well under its 10-Day Moving Average, that's a big red danger sign for long-term investors.  


ASX Advance-Decline Line.

This is another important indicator of breadth.


Like NH-NL Cum, ASX Advance-Decline Line is also bearish, but not quite as bleak as NH-NL Cum.
It is, however,  below its 10-DMA and its 20-DMA.  


% of Stocks above key moving averages.

1.  % of stocks above 10-Day Moving Average: Last Week 52%, This Week 53%.
2.  % of stocks above 50-Day Moving Average, Last Week 30%, This Week 31%.
3.  % of stocks above 200-Day Moving Average, Last Week 37%, This Week 38%

This is another indicator of weak breadth.  Despite the rise in the XJO the %age of stocks above key Moving Averages was relatively flat.

Weak breadth is often a leading indicator for falls in the market.

We need to see each of these parameters above 50% to feel comfortable about the XJO.

Conclusion.

1.  Monthly, Weekly Charts are non-trending - Daily Chart is in a medium term (15-Day) up-trend.  We need to see all three Charts in sync.

2..  Breadth is poor, so the most likely direction is down.  If breadth continues to be poor, we can expect a break down from the ranges, and a continuation of the bear market.  Perhaps not this week, but its not far off.

3.  50/200 DMAs are almost connected - that's stiff resistance.  Any rise is likely to be short-term when the XJO hits dual resistance of those two major MAs.

Thursday, June 2, 2022

Finspiration Australia. Chart Analysis for Australian and International Stock Markets.

 2/6/22.  XJO fell today -0.8%.


XJO remains in a short-term upsloping channel, which suggests the next move will be up.

If it remains in the channel, then a test of the all-important 200-DEMA is likely in the next few days.

Internals remain weak, with NewHighs-NewLows continuing to fall.


The current environment is not a positive one for long-term investors.

Saturday, May 21, 2022

Finspiration Australia. Chart Analysis of Australian and International Stock Marke

   Weekly Wrap - Week ending 20 May, 2022.

XJO Monthly Chart.


After three weeks of May, the monthly chart is range bound 6970-7630.  

The chart is currently below the 8-month EMA but it is essentially sideways.  

We need about another week of data to see how the Monthly chart is travelling

Weekly Chart.


XJO was positive this week, +1%, breaking four weeks in a row to the downside.

The chart is range bound, in concert with the monthly chart.  Medium term, the chart the chart remains bearish..  Hull MA13 is blue (bearish); Supertrend (1.5/7) is blue (bearish) and the chart is below the 8-Week EMA is heading down (bearish).  RSI and CCI are below their mid-lines (bearish) and Stochastic has fallen below its signal line (bearish).

The chart is, however, at the lower end of the range so we'll probably see a move to the upside in the coming week.

The chart shows a trading range in round figures from 7630 to 6930.  This week XJO finished at 7075.  

Daily Chart.


In the short-term, this chart is looking positive.  Indicators in the lower panels have turned up; Hull MA13 and Supertrend (1.5/7) in the top chart are also bullish.

The chart has now formed a higher low, that's half-way to concluding a new up-trend.  We still need to see a higher high to complete the criteria for an up-trend.

The daily chart is, thus, out of sync with the weekly chart - that's typical in a range-bound market.

Sector Changes - past week.


This chart shows the performance of each sector (plus Gold Miners, XJO, BEAR and IAF) over the past week.  

Pluses and minuses for sectors were evenly spread with six sectors up and five sectors down.  Materials (XMJ +3.65%) had a return to form as did Information Technology (XIJ +5.04%).  

Consumer Staples (XSJ -3.45%) was the worst after a poor report from Woolworths (WOW -6.08%) and a big fall in URW -7.87% after a big sale of stock under market value.


New Highs - New Lows Cumulative.

NH-NL Cumulative continues to fall and is now well under its 10-Day Moving Average, that's a big red danger sign for long-term investors.  


ASX Advance-Decline Line.

Like NH-NL Cum, ASX Advance-Decline Line is also bearish, but not as bleak as NH-NL Cum.
It is nudging on its 5-Week Moving Average and another good week would take it over that metric.


% of Stocks above key moving averages.

1.  % of stocks above 10-Day Moving Average: Last Week 20%, This Week 74%.
2.  % of stocks above 50-Day Moving Average, Last Week 36%, This Week 38%.
3.  % of stocks above 200-Day Moving Average, Last Week 33%, This Week 40%

Two out of three are below 50% level - which confirms the bearish status of the ASX.  This week's bounce has resulted in a bounce in the shortest term metric.  That could be the start of a medium-term trend reversal.

Last week I noted:   This is the second week in a row where %Stocks above 10-DMA has been 20% or below.  That's another contrarian signal for a short-term bounce.  We got that bounce this week.


The above chart compares the performance of XSJ Consumer Staples (yellow and blue candles) with XDJ Consumer Discretionary (blue and grey candles).  

If consumers are confident about the economy, they are usually happy to splurge on big ticket, discretionary items - companies such as Harvey Norman, JB Hi-Fi and car retailers.  If consumers are not so confident about the economy, consumers tend to delay buying big ticket items.  

Conclusion.

1.  Weekly and daily charts out of sync - typical of a range-bound market.  Traders will play the ranges.

2..  Short to medium term is looking good for further upside.  We've probably seen a bottom in the medium-term.

I gave three beaten down stocks as tips last week ALL, REH, JHX.  

     ALL:  Buy at or above 33.06.  Stop Loss at 31.64.

     REH:  Buy at or above 16.00.  Stop Loss at 15.02.

     JHX:  Buy at or above 40.64.  Stop Loss at 39.06

ALL triggered a buy on Thursday when it hit 33.06.  It finished Friday at 35.17.  That's a gain of +6.4% so far.  Move stop up to break even at 33.06.  Continue to move the stop up if ALL continues rising.

REH triggered a buy stop on Monday at 16.00, but continued to fall the rest of the week.  Stop Loss still not triggered.  REH is currently sitting on a loss of -3.4%.

JHX didn't trigger a buy stop.  No trade.  Forget about JHX,

From the two trades, we're sitting on a gain of +3%.

Saturday, May 14, 2022

Finspiration Australia. Chart Analysis of Australian and International Stock Markets

  Weekly Wrap - Week ending 13 May, 2022.

XJO Monthly Chart.


After two weeks of May, the monthly chart is in non-trending mode.  8-month EMA is trending down and this week, the XJO finished below the 8-MEMA.  Hull MA13 is trending up.  The Index is below the Supertrend (1.5/7).  Wait till the end of the month for clear long-term signal.

Weekly Chart.


XJO was negative this week, -1.81%, the fourth week down in a row.  

This chart is bearish.  Hull MA13 is blue (bearish); Supertrend (1.5/7) is blue (bearish) and the chart is below the 8-Week EMA which has turned down (bearish).  RSI and CCI are below their mid-lines (bearish) and Stochastic has fallen below its signal line (bearish).

That's a dreary outlook.

The chart shows a trading range in round figures from 7630 to 6930.  This week XJO finished at 7075.  

Daily Chart.


Friday was a serious up day for the XJO +1.93% .  It was a bullish engulfing candle, which coming at the low of a trend, is usually predictive of the end of the down-trend.

Thursday saw the Index at very oversold levels, with RSI below 30.  The Index duly delivered on Friday.

The short-term future of the XJO is looking positive.  XJO finished Friday at 7075.1  For a short-term trade, buy above 7077 with a stop loss at 7056.

Sector Changes - past week.


This chart shows the performance of each sector (plus Gold Miners, XJO, BEAR and IAF) over the past week.  

Health (XHJ +2.59%) sticks out like a sore thumb.  (Pardon the bad pun.). It was the only sector on the plus side.

Ten sectors were down.  Materials (XMJ -3.89%) was the worst.  Not long ago, XMJ was the mainstay of the XJO - not any longer.

XPJ (Property -2.55%) was hard hit again, but nothing like the previous week when it was down. -8.18%.  

Serious falls also occurred in the following sectors:  Information Technology -2.42%, and Industrials -2.22%

New Highs - New Lows Cumulative.

NH-NL Cumulative continues to fall and is now falling steeply under its 10-Day Moving Average, that's a big red danger sign for long-term investors.  


Below is a chart of % NH/NH+NL:


10-DMA of %NH/HN+NL is now the lowest it has been in the past 18 months.  As a contrarian indicator, that suggests we are near a low.


% of Stocks above key moving averages.

1.  % of stocks above 10-Day Moving Average, 20%.
2.  % of stocks above 50-Day Moving Average, 36%.
3.  % of stocks above 200-Day Moving Average, 33%.

All three are below 50% level - which confirms the bearish status of the ASX.

This is the second week in a row where %Stocks above 10-DMA has been 20% or below.

That's another contrarian signal for a short-term bounce.


Offence or Defence?


The above chart compares the performance of XSJ Consumer Staples (yellow and blue candles) with XDJ Consumer Discretionary (blue and grey candles).  

If consumers are confident about the economy, they are usually happy to splurge on big ticket, discretionary items - companies such as Harvey Norman, JB Hi-Fi and car retailers.  If consumers are not so confident about the economy, consumers tend to delay buying big ticket items.  

Consumer Staples are much more resilient to lack of confidence in the economy.  While they may delay purchasing a new refrigerator or Apple computer, consumers will still buy toilet paper and breakfast cereal.  In Australia, big retailers like Woolworths and Coles dominate the Consumer Staples market.

We can see in the above graph, that XDJ and XSJ were more or less in sync from May 2021 until February this year, when XSJ chart began to dominate the XDJ chart.  

That suggests that investors need to take on a more defensive posture than they had last year.

Note, however, the long lower tail on XDJ this past week.  The Index is attracting some buying power - so its fortunes may be change.

Conclusion.

1.  Weekly and daily charts are more or less in sync - bearish.  

2.  XSJ/XDJ suggests a defensive posture in investments.

3.  Contrarian indicators and support levels suggest the Australian market is at or close to a "bounce" level.  That will probably be a case of sell-the-rally. 

4.  Friday's good rebound may be a short-term game changer.  The intrepid can buy for a counter-trend rally.

Tips for the coming week.

Here are three beaten down stocks which, based on double divergences on MACD and MACD Histogram, are ready to make a rebound:  ALL, REH, JHX.  Do your own research on those stocks before buying.  You may have a different view.

ALL:  Buy at or above 33.06.  Stop Loss at 31.64.

REH:  Buy at or above 16.00.  Stop Loss at 15.02.

JHX:  Buy at or above 40.64.  Stop Loss at 39.06

Good Luck for the coming week.

Finspiration Australia. 14/11/23. Tues. Morning Report.

Mixed Results in New York.  Energy up. NAB ex-dividend today. Dow Jones +0.16%.  SP500 -0.08%.  Nasdaq -0.11%.  Small Caps -0.07%.  Banks -0...