Showing posts with label PositiveDivergences. Show all posts

Saturday, April 29, 2023

Finspiration Australia

       30/4/23.  Weekend Report -Week Ended 14/3523.

The Australian market eased back this week with the XJO down -0.29%.  In America, their market was strong.  Dow Jones up +0.86%.  SP500 +0.87%.  Nasdaq +1.88%.  Why?  Simple.  This past week saw some of the big American tech companies report (e.g. META, Amazon, Microsoft, Alphabet).  Their reports were received enthusiastically.  Australia, unlike America, doesn't have a big tech sector in its market, so we didn't follow the Americans to the upside.

OK - Let's get into it.

Long-Term View.  XJO Monthly Chart.


In April,XJO finished up +1.83%.  

The index finished above its 8-Month EMA.  Hull MA13 is bullish and Supertrend (10/1) is bullish.

RSI is above 50 - bullish.

DZ Stochastic is above its buy line, but turned down just a little.

Double MACD is trending sideways.

On Balance, the XJO finished bullish for the month.

Medium-Term View - XJO Weekly Chart.


XJO lost a little ground in the past two weeks (-0.48% and -0.29% after a strong second week (up +1.98%). 

RSI is its 20-Day MA - that's bullish.  DZ stochastic remains bullish but into its overbought zone.

The chart finished above its 8-Week EMA.  Hull MA13 remains bullish and Supertrend (10,1) is bullish.

Again, the only blemish on the chart is the Double MACD which hasn't had a positive cross-over.  It tends to lag bit.


Short-term View - XJO Daily Chart.


The short-term view turned bearish this week.  The index was under pressure the previous week when Hull MA13 turned down.  This week, the chart finished below its 8-Day EMA, Supertrend turned bearish and Hull MA13 remained bearish.  

RSI finished below its 20-Day MA and DZ Stochastic has given a sell signal.  Double MACD has had a bearish x-0ver and CCI has closed below its 8-Day EMA.

With both Weekly and Monthly charts both bullish - we are probably looking at a short-term pull-back in the ASX.  Wait to see if this turns bullish before re-entry.

Daily Chart with Standard Error Channel.

XJO shows at the bottom edge of the Standard Error Channel.  This is a statistical representation of normal distribution of an Index or Stock.  As XJO is at the lower edge - we can expect a move back up to the upside.  It won't necessarily happen - but the probability is high.

SP500 Daily


SP500 has turned bullish - and that will probably drag the XJO back into bullish territory.

Weekly Changes in Sectors.


This week, ups and downs in the sectors were fairly even with a slight lean to the bearish side.

Four sectors were clearly up,  Property +2.07%m Telecommunications Services +1.7%, Information Technology +1.07%, Industrials +0.42%.  Financials finished just marginally on the positive side, +0.02%.

Five sectors were clearly down.  Materials -1.68%,  Utilities -0.95%, Health -0.58%, Energy -0.48%.  Discretionary fell marginally on the negative side, -004%.

Financials make up 25.8% of the ASX, Materials make up 23.6%.  Almost half the ASX is made up of those two sectors.  Extreme weakness in one or the other means the ASX will fall.  That happened this week with Materials down -1.68% while Financials was flat.


Sector Momentum.


All three columns sloping up - bullish trend. XIJ, XTJ, XPJ, XNJ.
All three columns sloping down - bearish trend.  XMJ, XUJ.
Down then up - counter trend bullish rally.  XXJ, XEJ,
Up then down - counter trend bearish pull-back.  XDJ, XHJ, XSJ, Gold, Composite Bonds (IAF).

Daily over-bought Momentum shows up in Telecoms - so it may not pay to go chasing strong stocks in that sector (e.g., Telstra).

NewHighs-NewLows.

This is a long-term indicator, but a good guide for long-term investors.


NH-NL Cumulative is above all its MAs (5,10,21).  This is giving it a positive diversion from the ASX chart.  That's a positive development and suggests more upside in the XJO.


Stocks/Bonds Ratio.


The past two weeks have favoured bonds over stocks - the ratio chart is falling.  

A negative x-over of the 5-Day MA below the 21-Day MA is usually a good sign of a return to bear market conditions.  That hasn't happened yet - but could happen if bonds continue to be favoured over stocks.


% of Stocks above key moving averages.

1.  % of stocks above 10-Day Moving Average: Last Week 56%, This Week 46%.  
2.  % of stocks above 50-Day Moving Average, Last Week 65%, This Week 69%.  
3.  % of stocks above 200-Day Moving Average, Last Week 68%, This Week 61%.
4.  % of stocks above Hull MA13, Last week 43%, This Week 42%

We're seeing a mixed picture this week with long-term indicators remain in bullish territory while the shorter term indicators are in bearish territory.


The chart for stocks above the 200-Day MA has fallen back below its 5-Week MA but remains above its mid-line (50%).  That's in keeping with the pull-back we've seen so far this past couple of weeks.

Conclusion.

The past two weeks appear to be a pull-back in an on-going bullish market.  Watch for a resumption of the short-term upside trend this week.  No guarantees, but the probabilities lie to the upside.


Saturday, October 15, 2022

Finspiration Australia. Chart Analysis for Australian and International Stock Markets.

Weekly Wrap, Week ended 14 October, 2022.  Is the Bear finished?

XJO Monthly Chart.


This chart is almost identical to the one shown last week.  XJO made a good start to the month, but this is only Week One of October.  Week Two has been flat.  The chart remains in a down trend.

XJO Weekly Chart.


This week's candle is a "dragonfly doji" - which means the XJO finished almost where it started after having a big dip down during the week.  XJO finished down just -0.06%, essentially flat.

This week's candle remains marginally above the 8-Week EMA.  One of the two Supertrend lines has switched from blue (bearish) to yellow (bullish).  That suggests the XJO is in non-trending mode.  Hull MA13 remains headed down.  This chart is more bearish than bullish. has run into the resistance of the other Supertrend lines.

XJO has, however, bounced off horizontal support - so it may be headed higher to again test the 50-Week MA as resistance.

XJO Daily Chart.


XJO was down strongly on Monday, waffled around on Tue-Thur, then surged higher on Friday.  

The Index remains within the confines of the descending broadening wedge shown on the chart.  A break to the upside of that wedge would be bullish, but then it faces the resistance of the 200-Day MA.  As a general rule, it is best not to enter long-term positions while the chart is below the 200-Day MA.

This week saw the XJO test the 50% retracement of the previous rally, and then bounced.  That could be the start of another test of the oblique restraining line of the descending wedge.  A break above that should see the continuation of the counter trend rally

Action on Friday raises the possibility that Tue-Thur is a higher low.  We need to see a higher high to call this a bull rally, i.e., XJO must rise above 4 October.

SP500 Daily.


This is a fascinating study in chart analysis.  From the high in August, the chart has made lower highs and lower lows - the definition of a down trend.  The lower highs have all occurred after counter-trend rallies up to the descending 20-Day MA.  Each time, the chart has declined to form a lower low.

Momentum is slowing as shown by the MACD Histogram.  It shows a positive divergence from the chart.  This suggests the possibility of a trend change.

Thursday saw one of the biggest reversal days on the SP500 for the past 50 years.  That produced a lot of euphoria - to be dampened by a big down day on Friday.  Volatility like this often occurs at the end of trends as the bulls/bears battle for supremacy.

It will mean down day on the XJO on Monday.

ASX Sector Results for this week.


Three out of eleven sectors were up this week, two of those (Consumer Staples and Consumer Discretionary) were only up marginally.  XJO finished flat for the week, but it was largely the good performance of Financials (XXJ) which kept the XJO more or less on an even keel.  XXJ up +3.61%.   

Relative Strength of Sectors.

RSI (Relative Strength Index) is calculated using the default setting of 14 days - almost three weeks of trading.  It provides a more reliable guide to changes in sectors than the one-week results which can jerk around quite a lot and, thus, RSI is probably a more reliable guide to recent strength in the sectors. (Click here for a description of RSI.)


Four sectors out of eleven are above 50:  Financials (XXJ), Materials (XMJ), Energy (XEJ) and Industrials (XNJ).  That's the same as the previous week.  Leadership has now shifted from Energy to Financials.  Energy and Materials were weak this week, but a return to the upside should lead to an improvement in the XJO as a whole.

NewHighs-NewLows Cumulative.


This is a metric for the long-term investor.  While NH-NL Cumulative remains below its 10-Day Moving Average, it is best for long term investors to remain cautious and defensive regarding the market.

% of Stocks above key moving averages.

1.  % of stocks above 10-Day Moving Average: Last Week 76%, This Week 54%.  
2.  % of stocks above 50-Day Moving Average, Last Week 26%, This Week 27%.  This remains bearish.
3.  % of stocks above 200-Day Moving Average, Last Week 21%, This Week 29%.  That's an improvement but still bearish.


The long term metric (% Stocks below 200-Day MA) remains very bearish but above its 5-Week MA.  That's promising. I'd like to see this above at least 40% before feeling comfortable.

Conclusion.
 
Overall, our market remains bearish, but we may be seeing a nascent counter-trend rally.

Remember that bear markets tend to reverse quickly.  Just because the market is bearish doesn't mean it can't change to the upside in the blink of an eye.  The stock market tends to be forward thinking - and can reverse when everything looks bleak.  While the Federal Reserve keeps chanting their mantra of higher rates, that is capturing the thinking of many investors.  Irristible forces in the stock market might have other ideas.

I'll leave you with the same thought I gave you last week.

Interestingly, the stock market in 2022 has generally followed the downward path typical for a midterm election year since 1962, according to Dan Clifton at Strategas. The S&P 500 is down slightly more than the typical 19% intra-year decline, but the news improves if stocks stick to the script. Stocks have historically bottomed in October and rallied by an average of almost 32% in the next twelve months. Clifton notes that stocks have been positive in the year after every midterm election since 1942!

Stay Safe.


Friday, September 30, 2022

Finspiration Australia. Chart Analysis for Australian and International Stock Markets. +Bitcoin.

1/10/22/. American stocks continue to tumble.


 Dow Jones -1.71%.  SP500 -1.51%.  Nasdaq -1.51%.  Small Caps -0.65%.  Banks -0.84%.

SP500.


SP500 is again extremely oversold with an RSI at 28.47 but showing a small positive divergence.

Stochastic remains in its oversold zone.  While it remains in that oversold zone, it is best to resist the temptation to re-enter the market.

A big positive divergence remains on MACD Histogram, that continues to suggest that SP500 is reaching for a bottom and a sustained counter-trend rally is possible.

Commodities.


Commodities continue to suffer along with stocks.  Commodities Index -1.24%.  Energy -1.74%.  Base Metals -2.08%.  Agriculture -0.65%.  Gold flat +0.01%.  The long upper wick on the Gold candle suggests intra-day selling after Gold tested the 20-Day MA.  Not a good sign for Gold.

Yesterday in Australia.

XJO fell heavily yesterday -1.23%.  It remains in a consolidation pattern after hitting the lower edge of the expanding wedge on Monday.  Until XJO breaks above the upper edge of the expanding wedge, it is best to stay on the sidelines.

Bitcoin.


Bitcoin is up +0.19% in low conviction trading.  The chart has formed a "saucepan" bottom which could lead to a counter-trend rally.  Just don't expect too much from it.


Tuesday, August 9, 2022

Finspiration Australia. Chart Analysis for Australian and International Stock Markets.

10/8/22.  Overnight U.S. stocks fall.  Tech hard hit.


Dow Jones -0.19%.  SP500 -0.42%.  Nasdaq -1.19%.  Small Caps -1.44%.  Banks +0.45%.

European stocks also fell with the Euro Stoxx 50 down -1.11%.

SP500.


The modest fall in the SP500 keeps it in short-term and medium-term up-trends.  The longer term remains in doubt with the Index below the 200-Day MA.

The negative divergence on CCI suggests further falls down from the Horizontal Retracement Zone, 50%-61.8% of the fall earlier this year.

Plenty of near-by support may cushion any further falls.

Tonight in the U.S., CPI data is released.  If inflation ticks higher, the Fed. may be more aggressive in its next interest rate rise.

Commodities.  Out of step with Stocks.


Commodities Index +0.93%.  Energy +0.95%.  Base Metals +1.42% and up to the 50-Day MA, Agriculture +0.4%.  Gold tipped above its 50-Day MA, up +0.31%.  Expect more upside in Gold.

Iron Ore -1.5%.  Thermal Coal +3.6%.

Lots of plusses and minuses for Australia in the overnight data.  Stronger base metals, Energy and Banks should limit losses today in Australia.

After 15 minutes of trading, XJO is down -0.47%.  BHP is flat +0.05%, but Rio has risen +0.57%.  


Tuesday, June 21, 2022

Finspiration Australia. Chart Analysis of Australian and International Stock Markets

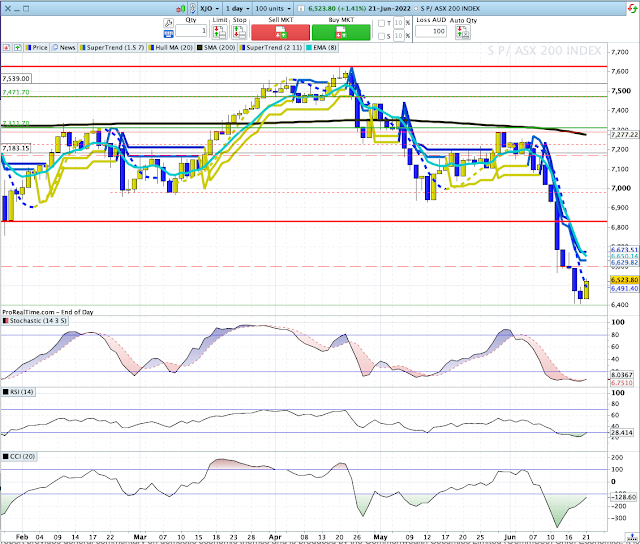
 XJO up strongly today +1.41%

The XJO shows a bullish engulfing candle.  That's usually a reliable signal.

The XJO is probably in a short-term upside move, a counter-trend rally.

The Index was very oversold (below 30) and the CCI shows a positive divergence.

So we can expect a few days to the upside.

Today eight sectors were up and three down.  That's a good breadth spread.

Financials (XXJ +2.65%) was one of the better results in the sectors.


That's a great bullish candle on the XXJ today - but it still has a lot of work to do to prove its bullish credentials.

Tuesday, June 14, 2022

Finspiration Australia. Chart Analysis of Australian and International Stock Markets.

15/6/22 Mixed Results in the U.S.


Dow Jones -0.5%.  SP500 -0.38%.  Nasdaq +0.18%.  Small Caps -0.27%.  Banks -0.92%.

SP500.


Momentum to the downside is slower.  Momentum must slow before the Index can reverse to the upside.

Positive divergences on MACD and Money Flow Index suggest a move to the upside is coming soon.

Commodities.


Commodities remain bearish.  Commodities Index -1.1%.  Energy -1.11%.  Base Metals -1.7%.  Agriculture -0.28%.  Gold -0.8%.

Iron Ore -0.9%,  Thermal Coal -1.8%.

After 15 minutes of trading this morning, XJO is down -0.6%.

Saturday, June 11, 2022

     Weekly Wrap - Week ending 10 June, 2022.

XJO Monthly Chart.


XJO is only ten days into a new month (June).

The monthly chart remains range bound 6930-7539, but now at the lower edge of that range.  XJO finished Friday at 6932

The chart is  is essentially sideways as indicated by the two flat Supertrend lines, one above and one below the monthly candles.  

The MACD Histogram has fallen this week to the down-side, indicating that momentum is to the downside.

Weekly Chart.


XJO This week, XJO has its worst week since April, 2020, down -4.24%.  That broke a three week positive run.

The chart is range bound, in concert with the monthly chart, but clearly at the lower end of the range  

Medium term, the chart remains bearish..  Hull MA13 is blue (bearish); two Supertrend lines are blue (bearish) and the chart is just below the 8-Week EMA (bearish).  RSI and CCI are below their mid-lines (bearish). MACD Histogram is falling - momentum to the downside is increasing.

The chart is, however, rising from the lower edge of the range

Last week XJO finished at 7239, this week it finished at 6932.  

Daily Chart.


Both Supertrend Lines are bearish, Hull MA13 is bearish; Chart is below the 8-DEMA which is bearish.

On the bright side, there is a double positive divergence on the MACD histogram and the MACD itself.

That has a reasonably reliable leading indicator.  It suggests that the Chart will move up in the coming week.  

ASX is closed on Monday, 13 June for Queen's Birthday celebrations in the southern states.  So our market might escape the catastrophic fall in the U.S. on Friday if the U.S. bounces on Monday.

The ASX this week was knee-capped by a huge fall in Financials, down -9.01% after the Reserve Bank raised interest rates by more than expected +0.5%.

I'm a bit perplexed by the fall in the Financial Sector.  Rising interest rates are supposedly good for Banks as they can increase margins.  So the "big boys" who control the market must be assuming that economic activity will be so poor that will impinge on banks, and, possibly, they are expecting a large number of customers to fail in their loan repayments.

In yesterday's post, I looked at ANZ, one of the four big banks which dominate the Financial Sector.  That examination was hopeful of a rebound in ANZ, which would be reflected in the other three big banks.  So we may have seen the worst of the falls in Financials, at least in the short-term

SP500.


On Friday night, SP500 gapped down at the opening and continued falling to finish down -2.91%.

That move takes the SP500 down into a support zone from which it has bounced several times in the past.  After such a big fall, it is likely that SP500 will bounce again.

Sector Changes - past week.


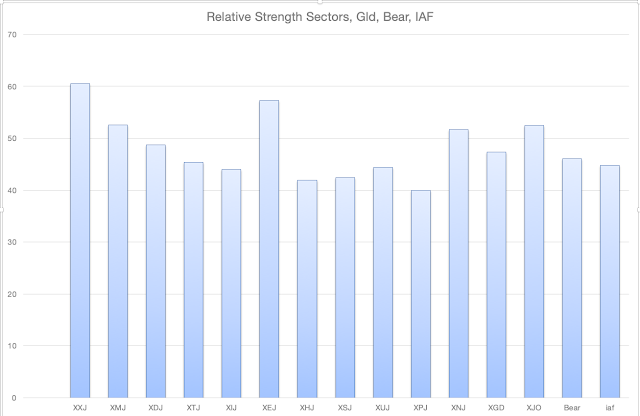
This chart shows the performance of each sector (plus Gold Miners, XJO, BEAR and IAF) over the past week.  

Two sectors up, one flat and eight down. The best was Energy XEJ +4.97%, followed by Utilities XUJ +0.46%.  Energy fell heavily on Friday, down -1.64%.  It's run up might be coming to an end.

Financials (XXJ -9.01%) is the biggest sector in the market and a major drain on the performance of the XJO this week.  Not far behind is Real Estate XPJ -7.67%.  XPJ is an interest rate sensitive sector, so the big fall in XPJ is understandable.  The other sector highly sensitive to interest rate movements is Information Technology -4.81%.

New Highs - New Lows Cumulative.

This is one of the important breadth indicators.  Unless breadth is solidly positive, the market is always under threat.

NH-NL Cumulative continues to fall and is now well under its 10-Day Moving Average, that's a big red danger sign for long-term investors.  


ASX Advance-Decline Line.

This is another important indicator of breadth.


ASX Advance-Decline Line is also bearish, and in sync with NH-NL Cum.


% of Stocks above key moving averages.

1.  % of stocks above 10-Day Moving Average: Last Week 53%, This Week 17%.
2.  % of stocks above 50-Day Moving Average, Last Week 31%, This Week 18%.
3.  % of stocks above 200-Day Moving Average, Last Week 38%, This Week 29%

This is another indicator of weak breadth.  

Once these instruments fall below 20, that's a contrarian signal that the market might bounce.  Two out of three instruments are below 20.  It would be even stronger if the third one was below 20, but we are looking at a very weak oversold market, so the chance of a bounce is good.

I don't think there's any point in jumping the gun, if we're reaching an inflection point in the market, there'll be plenty of time to hop on a new trend.

Seasonally, we often see a medium term up-trend in stock markets.  I'd wait and see how this pans out.


Conclusion.

1.  Monthly, Weekly and Daily Charts are at the lower end of their ranges.   I could speculate that we'll bounce here, and there is some evidence for such a view, but jumping the gun could be dangerous move.

2.  Breadth is poor, so poor that contrarians will be salivating at the prospect of new buying coming into the market.  Contrarian signs are not always reliable, and sometimes well ahead of what could happen.  

3.  We need to see a move up on the Stochastic Daily chart.

4.  Double positive divergence on MACD and its Histogram point to the possibility of a move to the upside.


Friday, June 10, 2022

Finspiration Australia. Chart Analysis for Australian and European Stock Markets

 11/6/22.  In Australia yesterday.


Yesterday, XJO fell -1.25%, or -87.7 points.  For the week, XJO was down -4.24%.  That's the worst weekly performance since April, 2020,  just after the bear market of March, 2020.

A 52-week low was set for the XJO at the end of January, 2022.  The close on that day was 6838.3.  XJO finished yesterday at 6932.  That's 93.7 points away.  That's feasible given the magnitude of falls this week.  That 52-week low could be a turning point. 

Stochastic is in its oversold level, RSI14 is at 35.95 which is oversold.  Another big fall coming on Monday could take RSI14 into vey oversold territory which might be a catalyst for an upside move.  Of course, very oversold can become more very oversold back in March 2020.

Australian Banks are showing some promise of a rebound.  Below is a chart for ANZ:


CCI and Money Flow Index both show striking positive divergences from the ANZ chart.  Those two indicators are often good leading indicators for a trend reversal.

Yesterday's candle is a huge "tombstone" candle.  The upper wick is especially long.  Tombstones are often seen at the end of a down-trend. 

RSI14 is extremely oversold at 21.43.  Rarely do we see a reading below 25 without a rebound.

Stochastic is in its oversold zone.  A move up would indicate a short-term buy signal.  Any move up could precipitate a short covering rally.

Overnight.


Dow Jones -2.73%.  SP500 +2.91%.  Nasdaq -3.52%.  Small Daps -2.49%.  Banks -4.34%.

SP500.


SP500 gapped down at the opening and just kept going.

Money Flow Index shows an extreme positive divergence from price.  So a bottom may be in place soon.

Commodities.


Commodities Index -0.98%.  Energy -0.92%.  Base Metals -1.79%.  Gold +1.34%.

Gold gapped down at the opening, but then reversed to the upside under heavy buying.    That could signal the end of the bearish market in Gold.

Gold.


The bullish engulfing candle last night in Gold took the Gold chart above the 200-Day MA, which often provides a "go" signal for gold bugs.  GLD is now at resistance of the 50-Day MA, but the current momentum seems likely to overcome that resistance.


Finspiration Australia. 14/11/23. Tues. Morning Report.

Mixed Results in New York.  Energy up. NAB ex-dividend today. Dow Jones +0.16%.  SP500 -0.08%.  Nasdaq -0.11%.  Small Caps -0.07%.  Banks -0...