Tuesday, October 3, 2023

3/10/23. Tues. Evening Finspiration Report

 ASX fell in a heap today.  XJO -1.28%.


It was RBA Day today - the day when interest rate decisions are announced.  The rate was held steady, and, uusually for RBA Day, the market barely moved.  The interest rate decision was not the "cause" of today's big fall.

The XJO bottomed just after 11.00 a.m. (Eastern Summer Time) this morning, rose a little and then basically slid sideways for the rest of the day.  

XJO was almost down to 6900 today - the last support level before the World Ends.  No - not really.  But the next major support level is a long way further down.  I don't even want to think about it.

In early trading in Europe today, markets, in contrast to Australia, are relatively flat.  STOXX600 -0.04%.

DOW Futures +0.17%.

I think we'll have a better day tomorrow.

Only one sector was positive today, Health +0.24%.

Worst - Energy -3.69%.

Gold/Silver Index.

The Gold/Silver Index is closely watch by Gold Bugs.  When it is low or at a break-out point, Gold Bugs want to buy.  That happened last night, when the G/S Ratio broke out of its trading range.

Not that Gold was rising, Silver was falling at a much faster rate than Gold.  Silver fell last night by -4.52% while Gold fell only -1.05%.  So the break-out in the G/S Ratio is not a buy signal for Gold.

Gold Miners ETF today was down -3.42% and completed a Head/n/Shoulders topping pattern. 


Saturday, September 30, 2023

1/10/23. Weekly Finspiration Report.

 September was crook.  XJO down -3.5% for the month.  September is usually down, so nothing unusual there.  Only - it was unusual, unusually bad.  September averages about -1% down, so it was much worse than usual.

What about October?  October gets a bad rap for big, big declines.  Nobody who lived through it can forget 19 October, 1987 when the Dow Jones dropped 22.6%, in one day.   But - that's the exception to the rule, O is usually up about +1%.  So we've got September behind us.  we can look forward to better times.


XJO Monthly Chart 


I've been banging on about this for a long time, the monthly chart of XJO has been range bound since Nov. 2022 - no trend.  That's coming up towards a year.  Rarely do we see such a long-term range bound market. 

The range is conveniently marked by two Supertrend Lines.  Supertrend 2/11 1s the upper limit and it sits at 7554.  The lower limit is Supertrend 1/10 which sits at 6922.

History shows we are coming into the best six months of the year, so this current long-term sideways consolidation is likely to break to the upside.

This week, the RBA meets for its Interest Rate decision.  That could be market moving.  I doubt it will be enough to result in a break in the market through the restraining Supertrend,


XJO Weekly Chart.  


This week, the ASX fell modestly, down -0.29%.  A welcome reprieve from the volatility of the previous week.

Horizontal support held which is a big positive.


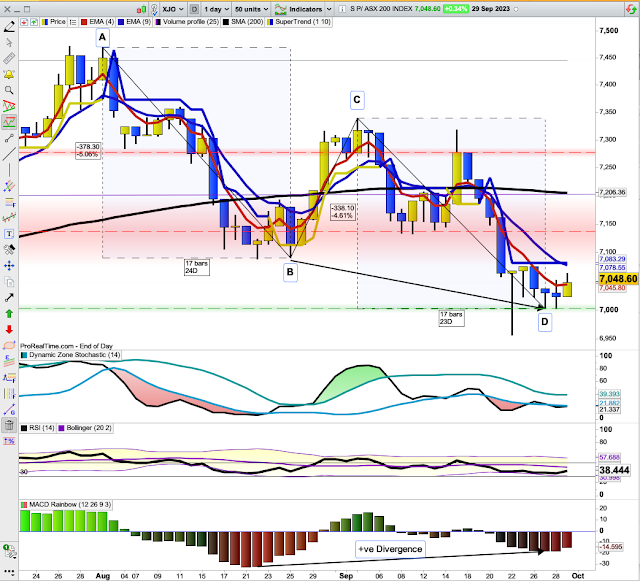
XJO Daily Chart.


 Horizontal support is shown by the dotted line from early July.  That held this week after being tested.  Friday saw a move to the upside which is a positive.

Positive divergence onMACD Histogram suggests the next major move will be to the upside.

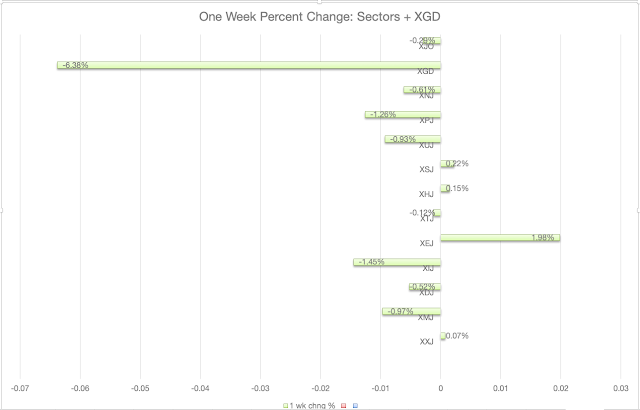
Sector Performances this week.

Best performing sector this week was Energy +1.98%Financials were flat +0.07%.  Financials are the largest sector in the ASX and that helped to keep falls in the broad market relatively small this week.

Defensives did realtively well.  Health +0.15%, Staples +0.22%.  Telecommunications -0.12%.


The worst performer was IT -1.45%.  Over the long term, IT tends to be a strong performer but jerks around a lot.  If we're looking at better times ahead, I'd expect IT to out-perform.

Property -1.26% was the next worst performer.  It is currently a basket case.  Since late August, XPJ has lost -9.13%.  An easing of interest rates would do wonders for XPJ but that may be a long wait.
 

100 Leader Stocks above their 200-Day, 50-Day and 10-Day Moving Averages.

  • Above their 200-DMA:  last week 37%, this week 36%.
  • Above their 50-DMA:  last week 25%, this week 27%
  • Above their 10-DMA:  last week 24%, this week 30%.

The Stocks above 50DMA are at 27% - we don't often see figures that low without a rebound coming soon.

The last time was in late June and early July. 

SP500 - American Market.

Here's the SP500 Chart:

DZ Stochastic has crossed above its lower Band, which provides a "buy" signal.  It's fairly reliable as seen back on mid-August.  When occurring with other indicators, that adds strength to the signal.  MACD Histogram shows a +ve Divergence to price, giving added weight to the DZ Stochastic "buy" signal.
 

Conclusion.

September was, predictably, poor - but worse than usual.

We're coming into October, usually a better month than September.  There are plenty of signs to suggest that the worst may now be past and we could be looking at some upside from here.

Good Luck

Be aware that there are no guarantees on the stock market.  The old adage must be remembered:  past performance is no guarantee of future performance.

If the market breaks decisively below support - then all bets are off.

Friday, September 29, 2023

30/9/23. Saturday Finspiration Report.

 ASX up moderately yesterday, while overnight the U.S. was ambivalent, Dow down, Nasdaq up.

XJO CHART     


Yesterday, XJO broke a three-day losing streak, up modestly +0.34%.

In the longer time frame, XJO seems to have completed an ABCD down trend with a positive divergence showing on the MACD Histogram. The ABCD pattern has taken two months to evolve.  In those two months, XJO has fallen -6.25%.

This looks like the end of the two-month down-trend.

Materials +1.22% was the best performing sector, while Energy -0.63% was the worst.

Overnight in America.


Dow Jones -0.47%.  SP500 -0.27%.  Nasdaq +0.14%.  Small Caps -0.68%.  Banks +0.14%.

Intra-day selling knocked the top off a positive start.

SP500.


 I think last night was the last hurrah of the bears.  Positive divergence on the MACD Histogram suggests more upside.

A controversial theory suggests that stock market returns are lower round a full moon and higher on a new moon.  Last night was a full moon.  (See here for evidence.)

Dynamic Zone Stochastic has moved up above its lower band - that's a short-term buy signal.

Commodities.


Commodities Index down, -1.07% after Energy fell heavily -1.31%

Weird session on Base Metals, huge gap up then a bunjee jump down and back up.  Base metals finished +1.32%.  Agriculture down heavily -1.79%.  Gold -1.03%.

September is usually the worst month of the year.  We've now got that behind us.

October is often bi-polar, down early then up later in the month.  So we could see some more fluffing about before we see some definite upside moves.


Thursday, September 28, 2023

29/9/23. Friday Morning Finspiration Report.

 Nice rebound in the American market last night.  Nothing startling but coming at the low end of a down trend it is promising.  Dow Jones +0.35%.   SP500 +0.59%.  Nasdaq +0.83%.  Copper up +2.08%.  Gold -0.49%.  WTI Oil -2%.  10 out of 11 sectors were up.  Energy was only just positive.  The one negative was Utilities.

Wednesday's "hanging man" candle (bullish) has morphed into a bullish candle on Thursday.  Expect more upside.

This morning. Sydney Futures are pointing to a positive start, up +0.64%.

Good Luck.


Thurs. Evening Finspiration Report.

 Action was choppy on the ASX today, with the XJO finished down marginally.  XJO -0.08%.


XJO continues to hover above a major support level.  Today's candle was a "spinner" with a narrow body and long wicks above and below the body.  This indicates indecision.

Despite today's flat finish, breadth was poor with only two sectors up, Energy +2.96% and Materials +0.29%.  Financials had a modest fall, down -0.25%.  

Worst sector today was Discretionary -1.18%.  

In early trading tonight, Euro STOXX600 is down modestly -0.38%.  Dow Futures down marginally -0.1%.


Wednesday, September 27, 2023

Yesterday in Australia, XJO finished down marginally after testing support and rebounding.  XJO -0.11%.

Last night in America, indices pulled the same Oz trick.  Down heavily just before 2.00 p.m. American time, indices finished down a little, or up a little.

Dow Jones -0.2%.  SP500 +0.02%.  Nasdaq +0.22%.

SP500


Coming at the low end of a down trend and a Hang-man candle, I think that will be the  end of this trend.  Look for follow-through buying.

Last night's action, plus the intra-day rebound in Australia, makes for a positive day to day in Oz, although our market will probably start on the downside.


Tuesday, September 26, 2023

Wednesday Morning Finspiration Report. 27/9/23.

The ASX is set to open on the downside this morning, with Sydney Futures -0.34% after the American market fell last night.  Dow Jones -1.14%, SP500 -1.47%, Nasdaq -1.57%, Copper -0.65% and Gold -0.91%.

Overnight, BHP -2%, Rio -1.68%.

SP500.


 SP500 is in the second wave down of its down-trend that started on 27 July. 

The index is now oversold with an RSI almost at 30.

The positive divergence on MACD Histogram suggests that the Index is close to a reversal point.  Major horizontal support and 200-Day MA are, however, still some distance away.

Stay with the trend until it has clearly ended.

RIO Tinto in America.

Rio is close to the Point of Control - the zone where the heaviest trading volume has occurred, so a reversal may not be far away.  Major horizontal support lies at 61.21.  Rio finished at 62.01.

U.S, VIX (Fear Index).


VIX, which trades inversely to stocks, is at the top of its range and showed a big intra-day reversal, so to a contrarian that suggests the fall in U.S. stocks is coming to an end.


Finspiration Australia. 14/11/23. Tues. Morning Report.

Mixed Results in New York.  Energy up. NAB ex-dividend today. Dow Jones +0.16%.  SP500 -0.08%.  Nasdaq -0.11%.  Small Caps -0.07%.  Banks -0...