ASX up moderately yesterday, while overnight the U.S. was ambivalent, Dow down, Nasdaq up.
XJO CHART
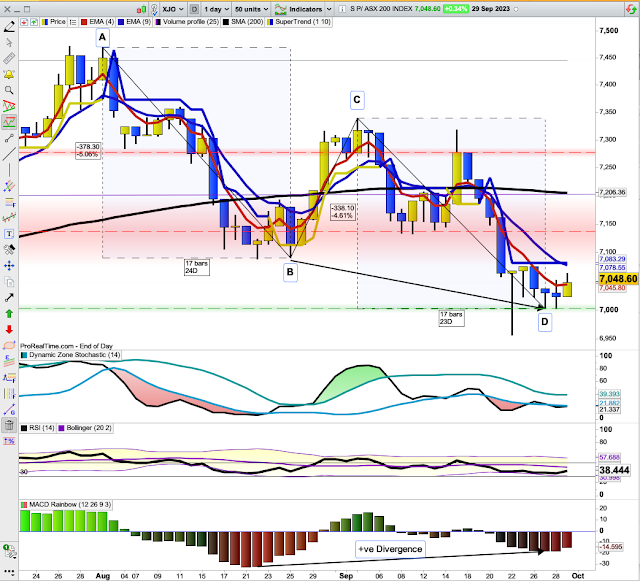
Yesterday, XJO broke a three-day losing streak, up modestly +0.34%.
In the longer time frame, XJO seems to have completed an ABCD down trend with a positive divergence showing on the MACD Histogram. The ABCD pattern has taken two months to evolve. In those two months, XJO has fallen -6.25%.
This looks like the end of the two-month down-trend.
Materials +1.22% was the best performing sector, while Energy -0.63% was the worst.
Overnight in America.
Dow Jones -0.47%. SP500 -0.27%. Nasdaq +0.14%. Small Caps -0.68%. Banks +0.14%.
Intra-day selling knocked the top off a positive start.
SP500.
I think last night was the last hurrah of the bears. Positive divergence on the MACD Histogram suggests more upside.
A controversial theory suggests that stock market returns are lower round a full moon and higher on a new moon. Last night was a full moon. (See here for evidence.)
Dynamic Zone Stochastic has moved up above its lower band - that's a short-term buy signal.
Commodities.
Commodities Index down, -1.07% after Energy fell heavily -1.31%
Weird session on Base Metals, huge gap up then a bunjee jump down and back up. Base metals finished +1.32%. Agriculture down heavily -1.79%. Gold -1.03%.
September is usually the worst month of the year. We've now got that behind us.
October is often bi-polar, down early then up later in the month. So we could see some more fluffing about before we see some definite upside moves.


No comments:
Post a Comment