Wednesday, May 10, 2023

Finspiration Australia.

 10/5/23.  Finspiration Wednesday Evening Report.

XJO down just -0.12% today after recovering (almost) from early losses.

Below is a chart for STW - a tracking ETF for XJO:


Intra-day buying is shown by today's yellow candle.

The chart has a slight upward bias, but anything can happen from here.


The middle Bollinger Band is the 20-Day MA - that's sliding sideways.  The chart is oscillating around that line - showing aimlessness or indecision.

The 20-Day MA acted as resistance on Monday.  Until that is overcome - caution is required.

The chart is marginally above the 8-Day EMA, which is below the 20-Day MA.  Ideally, I'd like to see the 8-Day EMA above the 20-Day MA.

In early European trading, STOXX600 is down a little -0.25%.

Pre-market Dow Futures are down a little -0.11%.

Anything can happen from here.

Tuesday, May 9, 2023

Inspiration Australia.

 10/5/23.  Wednesday Morning Finspiration Report.

U.S. Stocks slip into negative territory.


Dow Jones -0.17%.  SP500 -0.4%.  Nasdaq -0.63%.  Mid Caps -0.37%.  Small Cars -0.62%.  Banks flat  +0.03%.

SP500

SP500 is in a sideways consolidation movement, 8DEMA and 20DMA are both together at last night's candle.  

The chart is above both the 50-DEMA and 200-DEMA so the Index remains bullish in the longer term.

Commodities.


Commodities Index +0.3%.  Energy +0.87%.  Base Metals -0.42%.  Agriculture +0.24%.  Gold +0.71%.

BHP was down -0.64% overnight.

After 15 minutes of trading this morning, XJO is down -0.3%.

Last night's budget has been barely recognised by the market. 

Finspiration Australia.

9/5/23.  Tuesday Evening Finspiration Report. 

XJO down marginally today -0.17%.

Below is an equivolume chart for STW, a tracking ETF for the XJO.


STW finished above its 8-Day EMA and the Supertrend remains bullish.

DZ Stochastic and DZ RSI have crossed above their signal line.

The picture looks bullish.

Volume has been light - which puts some date on the strength of this upside move.

We are, however, in a short-term upside rally - so stay with the trend.


Monday, May 8, 2023

Finspiration Australia.

 9/5/23.  Tuesday Morning Finspiration Report.

Major Indices in America were flat last night.


Dow Jones =-.17%.  SP500 +-.05%.  Nasdaq +0.19%.  Mid Caps -0.29%.  Small Caps -0.5%.  Banks -0.26%

SP500


SP500 is bouncing between Bollinger Bands resulting in a flat 20-Day MA (middle Bollinger Band).

Wait till we see clearer direction.  MFI is suggesting that will be down.

Commodities.


Commodities Index +0.48%.  Energy +1.66%.  Base Metals +0.31%.  Agriculture -0.57%.  Gold +0.12%.

After yesterday's hefty rise in the XJO, we can't expect much from the XJO today after America was flat.  We'll probably be down a little today. 

Finspiration Australia

 8/5/23.  Monday Evening Finspiration Report.


XJO up strongly today +0.78% after a good move in America on Friday night.

In the short-term, the chart is bullish with the DZ RSI and DZ Stochastic both moving to the upside and marginally above their trigger lines.

In the medium term, the 20-Day MA is moving sideways and may prove resistance to further upside in the index.

A move higher tomorrow would be a "buy" signal.

Currently in Europe, stocks are nudging higher with STOXX600 up +0.24%.  U.S. Futures are mixed, with Dow Futures up +0.13%, but Nasdaq Futures down -0.9% - both are more or less flat.

Saturday, May 6, 2023

Finspiration Australia.

Sunday, 7 May, Weekly Report. 

If you thought this week was crook for the Ozzie Market - you weren't wrong.  XJO down -1.22% and nine out of eleven sectors were down.

Weekly Performance of Sectors (plus Gold Miners, XJO and Bonds)


Two sectors up - Utilities +2.05% and Property +1.35%.  Both are defensive sectors.

The next two best performing sectors (relatively) were also defensives, Health -0.11% and Staples -0.15%.

Worst performer was the biggest sector in the ASX, Financials (XXJ) -3.42%.  XXJ was hit with a double whammy - turmoil in the U.S. banking sector which spilled over to our banks, and then National Australia Bank (NAB) came out with a horror report.  NAB fell -6.41% on Thursday and impacted the other big banks.  On Thursday. CBA fell -2.57%, ANZ -2.37%, WBC -4.11%.  ANZ picked up considerable ground on Friday, up +1.45%, doing much better than the other three big banks.

Momentum.


RSI is a a good guide to momentum.  If the daily RSI is weaker than the weekly RSI, then that particular instrument is in danger.  

Guide to Momentum:

All three columns sloping up - bullish trend. XPJ.
All three columns sloping down - bearish trend.  XXJ, XMJ, XEJ.
Down then up - counter trend bullish rally.  XUJ.
Up then down - counter trend bearish pull-back.  XDJ, XTJ, XSJ, XNJ, Gold, Composite Bonds (IAF).

The only sector with bullish momentum was Property and Utilities was in a counter trend bullish rally.

STW DAILY CHART.

STW is a tracking ETF for the XJO.  I'm using an equivolume candlestick chart.  The body of the candle varies in width depending on the volume flowing into the STW on that day.  Changes in volume are often related to possible trend changes


In this chart, you can see that when the XJO (STW) was topping in 17-20 April, volume had dried up.  Volume drying up at the top of the trend - the Index will fall.  It's a bit like a hot-air ballon with the heat turned down - no heat - the balloon will fall.

We can see that on Friday, when the STW was positive, volume was better than the previous two days.  Heat turned up - the balloon goes up.  STW is likely to rise here.  Given events in the U.S. on Friday night, a rise on Monday appears to be a given.
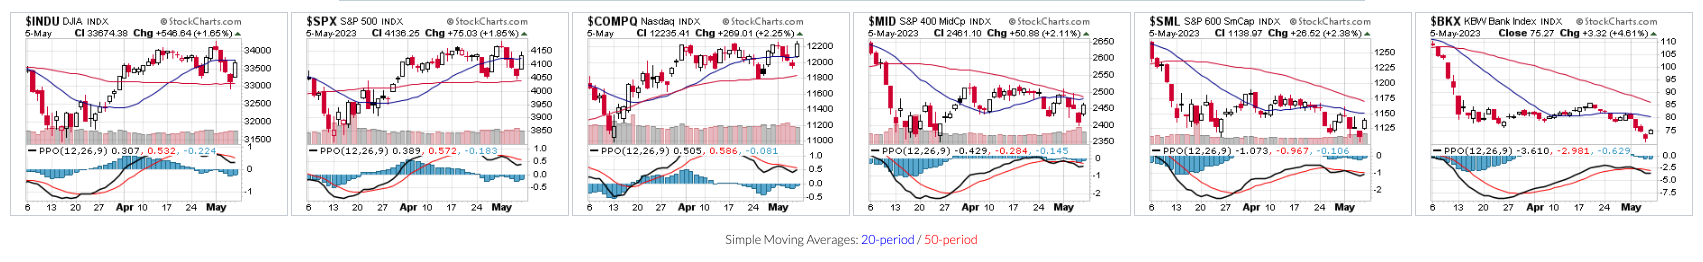
SP500 Daily Chart.


SP500 had a good rise on Friday night, up +1.85% and it finished above the 8-Day EMA and Supertrend has turned bullish.

I would have liked to see better volume on Friday's action, so there may not be a lot of oomph in this move to the upside.

NewHighs and New Lows.


This metric usually trends relatively well, but lately it hasn't known whether it is Arthur or Martha.

The 5-Day MA has been whip-sawing around the 20-Day MA.  

This the image of a volatile market.  Volatile markets are the enemy of the retail investor/trader.

Stocks/Bonda Ratio.


The Stocks/Bonds Ratio peaked recently on 19 April.  Since then it has been in decline and the 5-Day MA is now below the 20-Day MA.  X-Overs of the 5-Day and 20-Day have had a good record for predicting further downside in the market.  Until a positive cross-over occurs it might be wise to stay defensive.

Conclusion.

So - we're probably looking to a few days on the upside - until the SP500 tests its recent high.  Unless we see an increase in volume, that test will probably fail.

The Ozzie market has been under-performing the Americans for a while - but our market has fundamental differences from the American.  America pins its hopes on Technology - our market pins its hopes on Commodities.  BHP up +4.49% on Friday in America and formed a clear double bottom.  Apple up +4.69% on Friday on heavy volume. That's its highest point since August 2022.  I'd like to bet on BHP, coming off its lows, doing quite well in the near future.  Apple?  That's questionable.

Stay safe.


Friday, May 5, 2023

Finspiration Australia.

 6/5/23.  Saturday Finspiration Report.

Yesterday in Australia, XJO rebounded from a negative start to finish higher.  XJO up +0.37%.


The past two days have seen bottom-pickers active in the market.  On Thursday, the dragonfly doji finished finished back above the 200-Day MA.  Then on Friday it consolidated that with a positive move.  

Given the events overnight in the U.S., it looks like the bottom-pickers are on a winner.

Overnight in the U.S.


Dow Jones +1.65%,  SP500 +1.85%.  Nasdaq +2.25%.  Mid Caps +2.11%.  Small Caps +2.38%.  Banks +4.61%.

Apple reported after the market closed on Thursday.  It popped up on Friday, +4.7%.  The market was also helped by easing of fears in regional banks, KRE up +6.29%.

SP500.


That's a very bullish move last night for the SP500.  The chart moved above the 8-Day EMA and the Supertrend switched from bearish to bullish.

Indicators are still shy of giving "buy" signals - but they do seem to be imminent.

This seems set for a test of the recent high.

Commodities.

Commodities (except for Gold) also responded well last night.


Commodities Index +2.25%.  Energy +3.39%.  Base Metals +1.48%.  Agriculture +1.59%.  Gold -1.56%.

Ozzie big miners had a bonanza last night in the U.S.  BHP +4.49%.  Rio +3.56%.

Finspiration Australia. 14/11/23. Tues. Morning Report.

Mixed Results in New York.  Energy up. NAB ex-dividend today. Dow Jones +0.16%.  SP500 -0.08%.  Nasdaq -0.11%.  Small Caps -0.07%.  Banks -0...