Wednesday, April 26, 2023

Finspiration Australia.

 27/4/23.  Thursday Morning Finspiration Report.

Overnight in the U.S.  Industrials down, Tech up.  Meta up 12% after hours.


Dow Jones -0.68%.  SP500 -0.38%.  Nasdaq -0.47%.  Mid Caps -0.86%.  Small Caps -0.9%.  Banks -1%.

Breadth was poor with only one of eleven sectors positive, that was Technology.

SP500.

Triple Supertrend crossovers signal a bearish down-trend.  All indicators confirm the signal.  Wait.

Commodities.

Commodities Index -1.52%.  Energy -2.74%.  Base Metals +0.47%.  Agriculture +0.14%.  Gold -0.54%.

BHP and Rio both up overnight.

Sydney ASX Futures -0.22%.


Tuesday, April 25, 2023

Finspiration Australia.

 26/4/23.  Cryptos report.

Major Cryptos maintain bearish conditions - but close to changing.

BTCUSD.


Good night for BTC, up +2.86%.  It bounced off the 50-Day MA.  

DZ Stochastic has given a marginal buy signal and it finished marginally above the 8-Day EMA.

I'd like to see the RSI finish above the 20-Day MA and at least one Supertrend trigger a yellow line (bullish).

ADA


ADA up +2.84%.  A strong result but no buy signals triggered.  Wait.

MATIC.


MATIC down -1%.  The day's candle is a wide-range doji candle.  Coming at the low end of a down-trend, that may signal an end of the down trend.  But no buy signals triggered.  Wait.


Finspiration Australia

26/4/23.  Wednesday Morning Finspiration Report. 

Overnight in the U.S.  Stocks finish well down.


Dow Jones -1.02%.  SP500 -1.59%.  Nasdaq -1.96%.  Mid Caps -1.93%.  Small Caps -2.59%.  Banks -3.45%.

SP500.


Three doji candlesticks followed by a big down candle?  Indecision resolved.

All indicators are now bearish.  Wait for the down-trend to finish.

Commodities.


Commodities Index -1.42%.  Energy -2.82%.  Base Metals -2.42%. Agriculture +0.33%.  Gold +0.61%.

After 20 minutes of trading this morning, XJO is down -0.49%.  Big miners are taking the brunt of the bearish conditions.

In after market news in the U.S., Microsoft and Alphabet reported.  Both beat expectations.  That should flow on to the Oz market today, although - probably not enough to turn it positive.


Monday, April 24, 2023

Finspiration Australia

 25/4/23.  Tuesday morning Cryptocurrencies.

Four cryptos are covered in this report.  BTC, ETH, ADA, MATIC.  All four are currently on sell signals.  Wait-and-see.

BTC/USD,


BTC/USD remains on "sell" signals.

This crypto is in wait-and-see mode:  a couple of doji candle-sticks indicate indecision as it consolidates at the 50-Day MA. 

CCI has flattened out and DZ Stochastic has also flattened out and close to moving above its lower Zone line.

Money Flow is down almost to 20 - an oversold zone.

A break below the 50-Day MA would see further movement to the downside.  Buyers should look for a bounce off the 50-Day MA.
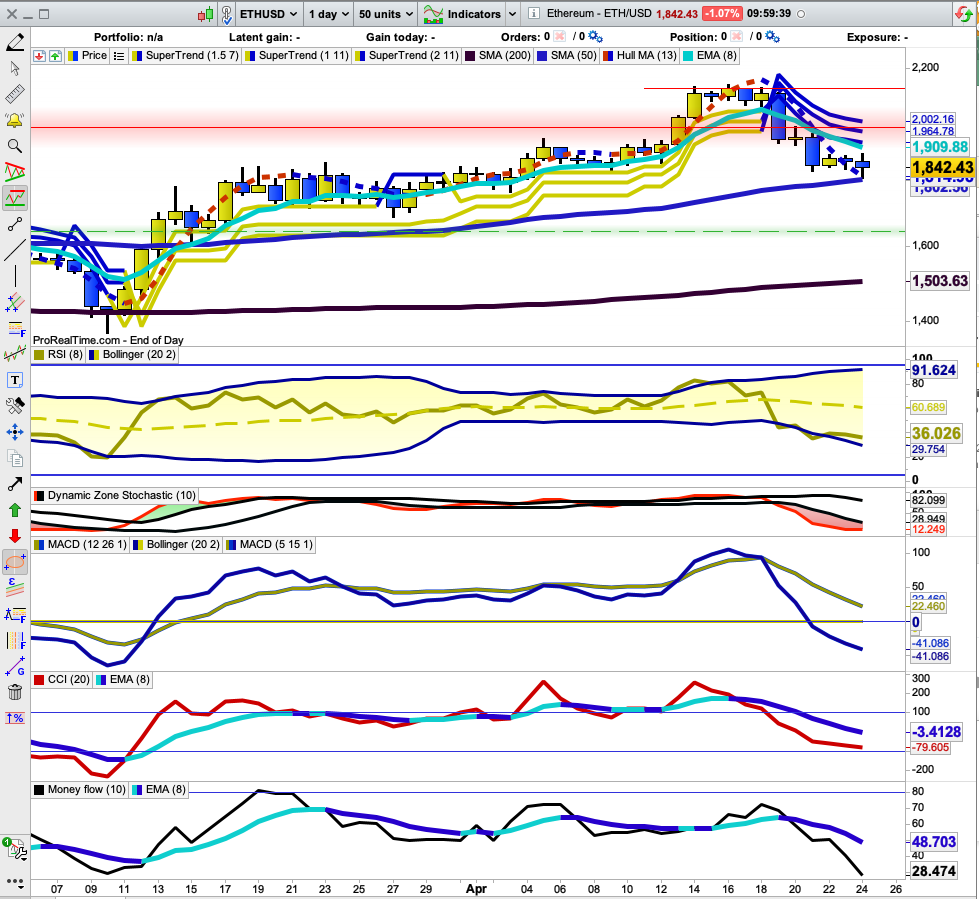
ETH/USD

Similar to BTC, ETH/USD is on sell signals.

The chart shows two doji candle-sticks in a row - indecision and the chart is sitting just above its 50-DMA.

A break below the 50-Day MA = more selling.

A bounce off the 50-DMA - probably a buy.  Wait-and-see.


ADA/USD


ADA/USD has a similar profile to BTC/USD,  but, perhaps, a little stronger than BTC.  It remains on sell signals.

This crypto is sitting a little above its 50-Day MA, so the same comments for BTC apply to ADA.  Bounce - and it is probably a buy.  Fall through 50DMA - probably more selling.

MATIC/USD.


Matic/USD is a little weaker than either BTC or ADA having fallen through its 50-DMA.

Leading indicators suggest, however, that the break below the 50-DMA could be a false break.

CCI is showing a clear positive divergence and minor positive divergences on RSI and DZ-Stoch.

Wait-and-see how this pans out.

Finspiration Australia

 25/4/23.  Tuesday Morning Finspiration Report.

Yesterday in Australia, XJO down marginally.

Overnight in the U.S., muted market with mixed results.

XJO Chart.


XJO has now triggered many short-term "sell" signals.  

  • Hull MA13 has switched from up to down.  (Dashed line on the chart.)
  • RSI has fallen below the mid-line (20-Day MA) of its Bollinger Bands.
  • DZ Stochastic has its bands squeezed together and the Stock line has fallen to the downside.
  • Short-term line of Double MACD has fallen below its long-term line.
  • CCI has fallen below its 8-Day EMA.
  • Chart has fallen below its 8-Day EMA.
Triple Supertrend lines still haven't switched from yellow to blue - that's a more of a medium-term signal.

U.S. Indices overnight.

Dow Jones +0.2%.  SP500 +0.09%.  Nasdaq -0.29%.  Mid Caps +0.02%.  Small Caps -0.01%.  Banks -0.41%.

SP500.

Sp500 is showing similar short-term sell signals to the Australian XJO.  Triple Supertrends continue to show bullish - this is more of a medium-term indicator.

SP500 is showing three doji candle-sticks in a row - indecision.  America is in the midst of Earnings Season - later this week some of the biggest Tech Companies report, e.g., Alphabet, Microsoft, Amazon and Meta.

The American market is in indecision mode waiting on those ginormous companies to report.

Other big U.S. companies reporting this week are:  Visa, Pepsi, McDonald's, Boeing, Intel, Mastercard, Exxon, Chevron, Colgate Palmolive.  So it's a big week for reporting in the U.S. this week.  This will have an effect on the direction of the market.

Next week, the Federal Reserve reports on its interest rate decision.  That's another overhang on the market.

Commodities.

Commodities Index +0.8%.  Energy +1.6%.  Base Metals -0.72%.  Agriculture +0.57%.  Gold +0.37%.

The Australian Market is closed for Anzac Day today.


Saturday, April 22, 2023

       23/4/23.  Weekend Report - The Week That Was.  Week Ended 21/4/23.

XJO Monthly Chart.


We've had three weeks so far in April.  XJO is up, so far, +2.13%.  

The three Supertrend lines are showing a non-trending long term index, one Supertrend line above the chart and two Supertrend lines below the chart.  All three Suprertrend lines are horizontal - indicative of a sideways trend.

MACD Histogram is sitting on its Zero line - confirming the no-trend info. from Supertrend.

RSI is above 50 - bullish.

DZ Stochastic is above its buy line, but turned down just a little.

There's not a lot of direction coming from the Monthly Chart.

XJO Weekly Chart.


The weekly chart shows the XJO in bullish mode, with all three Supertrend lines turning yellow.

DZ Stochastic is above its "buy" line.

RSI is above its centre line (20-Day MA), that's a "buy" signal.

Those two indicators confirm each other.

XJO was down -0.42% for the week.

XJO Daily Chart.


XJO is in pull-back mode.  The Hull MA13 shows a rounding top which is bears.

DZ Stochastic and RSI have both crossed below their signal lines - bearish.

DZ Stochastic Zone has crunched up to almost nothing - and is now starting to expand.  Expect more downside action.

SP500 Daily


Indicators on the SP500 are bearish.  DZ Stochastic and RSI are both below their signal lines - bearish.

CCI shows a big negative divergence which often precedes a pull-back.

Weekly Changes in Sectors.


Mixed results in the sectors this week, but the "ups" were modest, and the "downs" were big downs.

Best performer was Property +0.87%.  That's hardly indicative of a bullish market.

The weakest sectors were cyclicals, Energy -2.29%% and Materials -2.16%%

BHP and RIO both reported this week.  Media played up the positives in their reports.  Fund managers were less enamoured.  Macquarie put Rio on a "neutral" rating.  That's fund manager "new-speak" for "sell".

Sector Momentum.


All three columns sloping up - bullish trend.  XXJ, XHJ, XSJ, XPJ, XNJ.
All three columns sloping down - bearish trend.  XMJ.
Down then up - counter trend bullish rally. XEJ.
Up then down - counter trend bearish pull-back.  XDJ,XIJ,XTJ,XSJ,XUJ.

Last week, we had no sectors in counter-trend pull-backs.  This week we have five.  That could easily turn into bearish trends.  This is a picture which doesn't give a lot of confidence in the market.


Stocks/Bonds Ratio.


Stocks/Bonds Ratio were in a strong bullish rally.  That turned around this week with Stocks/Bonds Ratio falling below its 5-Day MA.  That still isn't into bearish territory but shows stocks weakening compared to bonds.


% of Stocks above key moving averages.

1.  % of stocks above Hull MA13, Last week 61%, This Week 43%
2.  % of stocks above 10-Day Moving Average: Last Week 81%, This Week 56%.  
3.  % of stocks above 50-Day Moving Average, Last Week 63%, This Week 65%.  
4.  % of stocks above 200-Day Moving Average, Last Week 67%, This Week 68%.


The two short-term metrics (HullMA13, 10-Day MA) have both dropped sharply this week - suggesting we are at the beginning of a serious pull-back.

Conclusion.
 
Monthly Chart - ambiguous.  Weekly Chart - bullish.  Daily Chart - bearish.

I think we're at the start of a significant pull-back.

Take Care.


It never pays to become too complacent about the market.  Nor does it pay to jump like a startled rabbit at the any sign of a pull-back.  

Stay vigilant.

Friday, April 21, 2023

Finspiration Australia.

22/4/23.  Saturday Morning Finspiration Report. 

Yesterday in Australia, XJO fell moderately.

Overnight in the U.S., stock market was flat.


XJO down -0.43% and showing the first definite signs of bearishness.  Hull MA13 (dotted line) has turned down and the chart finished below the 8-Day EMA.

Yesterday's dark candle, after two dojos, is a bearish signal.

DZ Stochastic closed below its upper Zone line.  That needs to be confirmed by a close by the RSI below its median line (20-Day MA) and short-term MACD (yellow) closing below longer term MACD (blue).

Overnight in America.


Dow Jones +0.07%.  SP500 +0.09%.  Nasdaq +0.11%.  Mid Caps -0.06%.  Small Caps -0.32%.  Banks -1.5%.

SP500.


SP500 has had two doji candlesticks in a row.  It remains just a tick above the 8-Day EMA and the past two days have bounced of the first of the triple Superintends.

RSI remains a tick above its median line (20-Day MA).  A drop below the 20-Day MA is bearish.

DZ Stochastic is bearish and short-term MACD is below long-term MACD.

Lots of indecision with two dojis and mixed indicator signals.  Wait.

Commodities.  Energy up, Base Metals down.

Commodities Index -0.21%.  Energy +0.83%.  Base Metals -1.16%.  Agriculture -0.66%.  Gold -0.99%.

With U.S. Banks and Base Metals down overnight, that looks dangerous for Australia on Monday.

Overnight in the U.S., our big miners were down.  BHP -3.23%, Rio -4.04%.  That re-inforces the notion that XJO will be down on Monday.


Finspiration Australia. 14/11/23. Tues. Morning Report.

Mixed Results in New York.  Energy up. NAB ex-dividend today. Dow Jones +0.16%.  SP500 -0.08%.  Nasdaq -0.11%.  Small Caps -0.07%.  Banks -0...