Tuesday, December 13, 2022

Inspiration Australia. Chart Analysis for Australian and International Stock Markets + Bitcoin

 14/12/22.  Finspiration Morning Report, Wednesday.

Dow up modestly overnight.  Commodities up strongly.


Dow Jones +0.3%.  SP500 +0.73%.  Nasdaq +1.01%.  Small Caps +0.35%.  Banks +0.04%.

CPI figures came in lower than expected (but still high) that had the effect of stocks opening gap up, but intra-day selling knocked the top off most of that.  

SP500.

Last night's dark candle indicates the extent of intra-day selling in the SP500.

Supertrend Lines show one bullish (yellow) and two bearish (blue) lines - a non-trending situation.

SP500 hit the top Supertrend line and above the 200-Day MA, but declined to finish below the 200-Day MA.  

The Index needs to turn all three Supertrend lines yellow (bullish) to give a new "buy" signal.

Commodities.


Commodities Index +1.65%.  Energy +2.42%.  Base Metals +1.13%.  Agriculture +0.61%.  Gold +1.71%.

The better than expected CPI figures resulted in the U.S. Dollar falling.  US$ has an inverse relationship to the price of Commodities.  The US$ fell last night, so Commodities priced in US$ rose.

Iron Ore Futures -0.3%.

Bitcoin.


Bitcoin was up >3% last night, giving some optimism for further rises.  It needs to turn all three Supertrend lines to yellow to give a "buy" signal.  Last time that happened, the rise was short-lived.  So don't get your hopes up too much.  While BTC remains below the 200-Day MA, I'll continue to believe that any rally is a counter-trend rally, likely to fail.

Finspiration Australia. Chart Analysis for Australian and International Stock Markets.

 13/12/22.  Finspiration Report Tuesday Evening.

ASX had a positive if disappointing day on the market today.


In early trading, XJO was up about +0.6% but weakened during the day to finish up +0.31%,

The chart remains in a short-term down-trend with a Triple Supertrend sell signal.

On the plus side, the 50-Day MA is close to completing a "Gold Cross" above the 200-Day MA.  That is usually taken by chartists as a change to a bull market.

Financials (XXJ) did well today, up +1.4% but the market was pulled back by a hit on the miners, XMJ down -1.4%.

Despite the positive result on the XJO, VIX rose today +2.05%,  Vix normally trades inversely to the major market index.

Breadth was flat today.  Advances 631. Declines 639.  New Highs 10, New Lows 13.

The big news tonight will be from the U.S. where the Consumer Price Index will be revealed.  That's a guide to inflation and what the Fed will do at its meeting this week.

Stay Safe.

Saturday, December 10, 2022

Finspiration Australia. Chart Analysis for Australian and International Stock Markets.

     11/12/22.  Sunday Report - The Week That Was.  Week Ended 9/12/22.

ASX took a thumping this week.  It would have been a lot worse if not for the Miners.

XJO Monthly Chart.


The month of December has started poorly for the XJO, down so far -0.975%.  But it is still early in the month.

The down-trend in the Monthly Chart may have been reversed.

The Hull MA13 and the 8-Month EMA Have both turned up.  That's significant.  Remember that Hull MA13 was the first indicator to turn bearish back in October 2021.  

The chart in December is knocking on resistance of the Supertrend (7/1.5).  That could cause the Index some problems.  It needs to get above that if the fabled Santa Rally is to emerge and fill investors' Xmas stockings.

XJO Weekly Chart.


In the past five days, XJO has fallen -1.21% completely reversing the previous week's rise and then some.

Despite this week's fall, the chart remains in a bullish up-trend and above all key moving averages.

Hull MA13 and the Supertrend Line are bullish.  The index has formed a double bottom.  Using a standard measure rule, that suggests the XJO will make a new all time high.

The Index is now well above the 50-Week MA which is a bullish signal.  Any pull-back will probably find support at the 50-WMA.


XJO Daily Chart.


Last week I said,  It is now time to tone down enthusiasm.  RSI reached 73.69 on Thursday, 1st December - well above the overbought level of 70.  

The Index has since reverted to a short-term down-trend.  There may be more downside to come.

Horizontal support exists at 7100 - a nice round number.  If the Index hits that it is likely to rebound.  XJO is currently at 7213.

Note that the XJO is close to completing a Golden Cross - that is when the 50-Day MA crosses above the 200-Day MA.  That is usually taken as a sign that a new bull-market has begun.

SP500 Weekly Chart


The weekly SP500 chart is lagging behind the Australian market  It remains in a long-term down-trend with lower highs and lower lows.  Weekly RSI is at 49.02, an ominous move below the 50 level

Supertrend Line, 8-Week EMA and Hull MA13 have all turned up.  Those are bullish events.

SP500 has been rejected  at the median line of the Andrew's Pitchfork and the 50-Week MA.  That all suggests more downside.   

Until I see a confirmed bull SP500, I'll remain a little cautious about the prospects for the Australian market.

The American market is quite a different beast from the Australian market.  The American market is heavily skewed to Technology and Energy.  Big Technology stocks (e.g. Amazon, Apple, Alphabet, Meta, Netflix) have been heavily impacted by Federal Reserve rate increases, pulling down the overall market.  U.S. Oil has also been falling heavily since June 2022.  So far in December it is down >10%.

The Australian market is skewed more to Mining and Banking.  Mining has been doing well with expectations that China will relax Covid restrictions and an easing in interest rates to boost its flagging economy.   In December so far, Mining and Metals is up >4%, and in November, up >18%,

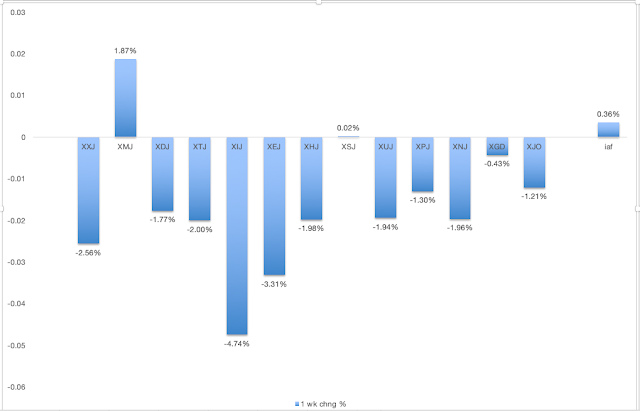
ASX Sector Results for this week.


Only one sector was up this week, and one flat.  Materials (XMJ) did well, up +1.87%, and Staples flat, up just +0.02%.  The weakest sector in our market was Information Technology (XIJ) down -4.74%.  Like the American market, our Technology stocks have been hit by interest rate rises, but, unlike America, Technology plays a much smaller part in our market.  Energy was also weak, -3.31%.  Our Energy sector is plagued by the same international forces as the American Energy sector.

Seven out of eleven sectors were down >19%.

Relative Strength of Sectors.

RSI (Relative Strength Index) is calculated using the default setting of 14 days - almost three weeks of trading.  It provides a more reliable guide to changes in sectors than the one-week results which can jerk around quite a lot and, thus, RSI is probably a better guide to recent strength in the sectors. (Click here for a description of RSI.)


Four out of eleven sectors have now fallen below the 50 RSI level.  The worst is Energy with an RSI of 37.25.  That makes it oversold, so it could rebound in the near future.  XXJ (Financials) is also looking weak with an RSI of 41.26.  Recently it had been quite strong, so it is not unexpected to see a pull back in. XXJ.  In October, XXJ was up >12% and also rose in November up >1%.   

XJO has fallen from above 70 RSI to a new level of 55.5.  That's still bullish, but weakening.

NewHighs-NewLows Cumulative.


Early this week, NH-NL Cum briefly rose above the 10-Day MA but fell back below the 10-Day MA.

Here's a longer term view of the NH-NL Cum showing both the 10DMA and the 20DMA.


This is a lagging indicator but bullish signals are usually highly reliable.  

This is a metric for the long-term investor. I'd like to see the 10-DMA above the 20-DMA to be confident of a long-term bull signal.  There's not much in it, at the moment, so it wouldn't take much bullish action to switch this into a bullish signa.

I've developed another metric StrongStocks-WeakStocks which is similar to NH-NL but gives signals a little earlier than NH-NL.


SS-WS is up for the fifth week in a row and has moved well above its 5-Week MA.   This week there were 15 Strong Stocks and 5 Weak Stocks.  Most of the Strong Stocks (Nine) were from the XMJ sector (Materials).  That gives some idea of how much our market is currently depending on XMJ.

% of Stocks above key moving averages.

1.  % of stocks above 10-Day Moving Average: Last Week 64%, This Week 33%.  
2.  % of stocks above 50-Day Moving Average, Last Week 85%, This Week 68%.  
3.  % of stocks above 200-Day Moving Average, Last Week 60%, This Week 55%.  

Both the medium-term (%stocks above 50DMA) and long-term (%stocks above 200DMA) measures are bullish.  The short-term measure (%stocks above 10DMA) has pulled back significantly this week as a result of this week's weakness in the broad market..  


% of stocks above the 200-Day MA fell this this week.  It remains above its 5-Week MA.  So it remains bullish.

Conclusion.
 
ASX had a poor week this week.  Daily and Weekly Charts are out of sync, Daily is bearish while Weekly is bullish.  We need to see the Daily return to bullish conditions if we are to see a strong Santa Rally.

Stay Safe. 

Friday, December 9, 2022

Finspiration Australia. Chart Analysis for Australian and International Stock Markets + Bitcoin

 10/12/22.  Finspiration Saturday Report.

Overnight, U.S. stocks retreat after late plunge.


Dow Jones -0.9%.  SP500 -0.73%.  Nasdaq -0.7%.  Small Caps -1.07%.  Banks +0.05%.

SP500.

SP500 remains at the low edge of its recent short-term pull-back.  That lengthens the odds that the pull-back will continue.

Very good support remains nearby:  horizontal support, Ichimoku Base Line, top of Kumo Cloud.

Resistance remains overhead:  200-day MA, Supertrend Line, Ichimoku Conversion Line.

The Index remains in the lower half of the upsloping Andrew's Pitchfork.  The Index could retreat a fair way before falling out of the Pitchfork and still remain bullish.

This is a battle between bulls and bears.  Wait.

Commodities.


Commodities Index +0.13%,  Energy +0.52%.  Base Metals -0.68%.  Agriculture -0.51%.  Gold +0.35%

Energy is the dominant factor in the Commodities Index.  Downside momentum appears to be weakening.  This can go either way but the greater risk is to the upside.

Yesterday in Australia.


Yesterday, the XJO was up moderately, +0.59%.  Like the SP500 it is teetering between support and resistance.  Wait.

Bitcoin.


Bitcoin in USD was down overnight -0.41%.  It continues to consolidate at the low end of its long-term bear market.  

I'd avoid BTC until I saw clear evidence of a return to bullish conditions.

Thursday, December 8, 2022

Finspiration Australia. Chart Analysis for Australian and International Stock Markets + Bitcoin.

9/12/22.  Finspiration Morning Report.

U.S. Stocks move higher.


 Dow Jones +0.55%.  SP500 +0.75%.  Nasdaq +1.13%.  Small Caps +0.46%.  Banks +0.18%.

SP500.


SP500 remains above triple support (horizontal support, top of Kumo Cloud, Ichimoku Base Line) and in the lower half of the up-sloping Andrew's Pitchfork.  It now has triple overhead resistance - Supertrend Line, Inchimoku Conversion Line and 200-DMA.  Between a rock and a hard place.

I would have liked to see a more convincing movement to the upside last night.  This looks more like consolidation than a rebound.

Commodities.


Commodities Index -0.17%.  Energy -0.58%.  Base Metals +0.05%.  Agriculture +0.05%.  Gold +0.08%.

After one hour of trading this morning, the XJO is up modestly +0.4%.

Finspiration Australia. Chart Analysis for Australian and International Stock Markets.

 8/12/22.  Finspiration Evening Report.

XJO followed the U.S. down last night.

XJO -0.75%.


XJO is now in a short-term down trend.  The next support level is at 7100 - the Base Line of the Ichimoku System.

The worst performing sector today was Energy (XEJ) down -2.73%.  There's not any indication yet that Energy is bottoming, but it is not far away.

Financials (XXJ) were down heavily today, -1%.  Again there is no sign yet that it is bottoming, but is not too far away.

This will turn around soon.


Stay Safe.


Wednesday, December 7, 2022

Finspiration Australia. Chart Analysis for Australian and International Stock Markets.

 8/12/22.  Finspiration Morning Report.

Choppy Trading in the U.S. sees Dow finish flat.  Energy rout continues.


Dow Jones +0.00%.  SP500 -0.19%.  Nasdaq -0.51%.  Small Caps -0.47%.  Banks +0.22%.

Three defensive sectors finished on the positive side, Health, Staples and Property.

The yield curve continues to invert and is now at levels not seen since the 1980's.  That says the U.S. will be in recession sometime next year.  Looks like the Fed. has overdone the interest rate increases.

SP500.

SP500 finished with a doji candlestick - shows indecision in choppy trading.

The Index is almost down to triple support - top of the Kumo Cloud, Ichimoku Base Line and horizontal support.  That's likely to hold.  Wait.

Commodities.


Commodities Index -0.5%.  Energy -1.88%.  Base Metals +1.53%.  Agriculture +0.1%.  Gold +0.9%.

Iron Ore Futures +0.66%.

Bitcoin.


Bitcoin was down -1.3% last night.  That's not enough to move the Renko Chart.

Bitcoin continues to consolidate at the lower end of its down-trend.  I'd avoid BTC until we see some more solid upside movement.

ASX Futures -0.15%.  That suggests a soft opening for the ASX today.

Finspiration Australia. 14/11/23. Tues. Morning Report.

Mixed Results in New York.  Energy up. NAB ex-dividend today. Dow Jones +0.16%.  SP500 -0.08%.  Nasdaq -0.11%.  Small Caps -0.07%.  Banks -0...