11/12/22. Sunday Report - The Week That Was. Week Ended 9/12/22.
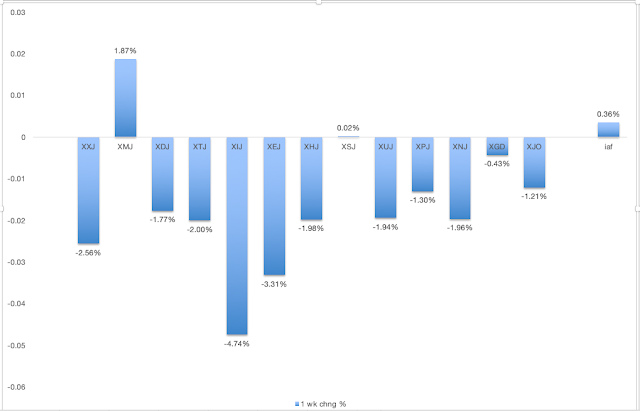
ASX took a thumping this week. It would have been a lot worse if not for the Miners.
XJO Monthly Chart.
The chart in December is knocking on resistance of the Supertrend (7/1.5). That could cause the Index some problems. It needs to get above that if the fabled Santa Rally is to emerge and fill investors' Xmas stockings.
XJO Weekly Chart.
SP500 Weekly Chart
The weekly SP500 chart is lagging behind the Australian market It remains in a long-term down-trend with lower highs and lower lows. Weekly RSI is at 49.02, an ominous move below the 50 level
Supertrend Line, 8-Week EMA and Hull MA13 have all turned up. Those are bullish events.
SP500 has been rejected at the median line of the Andrew's Pitchfork and the 50-Week MA. That all suggests more downside.
Until I see a confirmed bull SP500, I'll remain a little cautious about the prospects for the Australian market.
The American market is quite a different beast from the Australian market. The American market is heavily skewed to Technology and Energy. Big Technology stocks (e.g. Amazon, Apple, Alphabet, Meta, Netflix) have been heavily impacted by Federal Reserve rate increases, pulling down the overall market. U.S. Oil has also been falling heavily since June 2022. So far in December it is down >10%.
The Australian market is skewed more to Mining and Banking. Mining has been doing well with expectations that China will relax Covid restrictions and an easing in interest rates to boost its flagging economy. In December so far, Mining and Metals is up >4%, and in November, up >18%,
ASX Sector Results for this week.
Relative Strength of Sectors.
RSI (Relative Strength Index) is calculated using the default setting of 14 days - almost three weeks of trading. It provides a more reliable guide to changes in sectors than the one-week results which can jerk around quite a lot and, thus, RSI is probably a better guide to recent strength in the sectors. (Click here for a description of RSI.)
This is a lagging indicator but bullish signals are usually highly reliable.
This is a metric for the long-term investor. I'd like to see the 10-DMA above the 20-DMA to be confident of a long-term bull signal. There's not much in it, at the moment, so it wouldn't take much bullish action to switch this into a bullish signa.
I've developed another metric StrongStocks-WeakStocks which is similar to NH-NL but gives signals a little earlier than NH-NL.
SS-WS is up for the fifth week in a row and has moved well above its 5-Week MA. This week there were 15 Strong Stocks and 5 Weak Stocks. Most of the Strong Stocks (Nine) were from the XMJ sector (Materials). That gives some idea of how much our market is currently depending on XMJ.
Stay Safe.


No comments:
Post a Comment