Wednesday, December 7, 2022

Finspiration Australia. Chart Analysis for Australian and International Stock Markets.

 7/12/22.  Finspiration Wednesday Evening Report.

ASX follows overnight markets today.

XJO down -0.85%.


This is a Renko chart of the XJO.  Renko chart have the advantage of eliminating "noise" in charts.

This chart shows its first weakness since mid-October.  That's not enough for a "sell" signal.

But - the chart was overbought on the RSI (above 70) and in the "stress" zone on the Stochastic RSI.

Expect further downward movement.  Plenty of support exists nearby, so any pull-back is likely to be bought.


Tuesday, December 6, 2022

Finspiration Australia. Chart Analysis for Australian and international Stock Markets + Bitcoin

 7/12/22.  Finspiration Morning Report.

U.S. stocks fall for fourth day.  Energy down heavily.


Dow Jones -1.02%.  SP500 -1.44%.  Nasdaq -2%.  Small Caps -0.94%.  Banks -1.63%.

Ten our of eleven U.S. sectors fell.

SP500.


SP500 is down almost to critical triple support.  Expect a slowing of the downside movement or intra-day buying tomorrow.

The Index remains in the lower half of the up-sloping Andrew's Pitchfork.

Commodities.


Commodities Index -1.6%. Energy -3.15%.  Base Metals +0.54%.  Agriculture -0.71%.  Gold +0.27%.

Iron Ore Futures +0.3%.

Bitcoin.

In USD Bitcoin was up +0.5%.


Bitcoin continues to consolidate at the low end of its long down-trend.  Positive divergences on RSI and Stochastic RSI suggest a move to the upside might occur.

Finspiration Australia. Chart Analysis for Australian and International Stock Markets.

 6/12/22.  Evening Report.

Australian market down moderately today.  XJO down -0.47%.


XJO remains in a consolidation pattern. The Conversion Line of the Ichimoku pattern may provide support.

If that fails we have support from the Base Line at 7100 (round figures).  XJO currently at 7291.  I'm not expecting that to come into play.

XJO is in a strong upside trend.  Stay with the trend.


Monday, December 5, 2022

Inspiration Australia. Chart Analysis for Australian and International Stock Markets + Bitcoin.

 6/12/22.  Tuesday Morning Report.

Overnight in America, Dow drops almost 500 points, -1.4%.  Energy down heavily.


Dow Jones -1.4%.  SP500 -1.79%.  Nasdaq -1.93%.  Small Caps -2.72%.  Banks -4.39%,

All sectors in the American market were down.

SP500


SP500 has failed at the 200-Day MA.  It remains in the lower half of the up-sloping Andrew's Pitchfork.

The Index has a triple support area nearby:  horizontal support, the top of the Kumo Cloud and the Ichimoku base line.  That's strong support and will probably hold.

Commodities.


Commodities Index -2.59%.  Energy -3.89%.  Base Metals -1.32%.  Agriculture -0.45%.  Gold -1.72%.

 Iron Ore also fell, -1.9%.

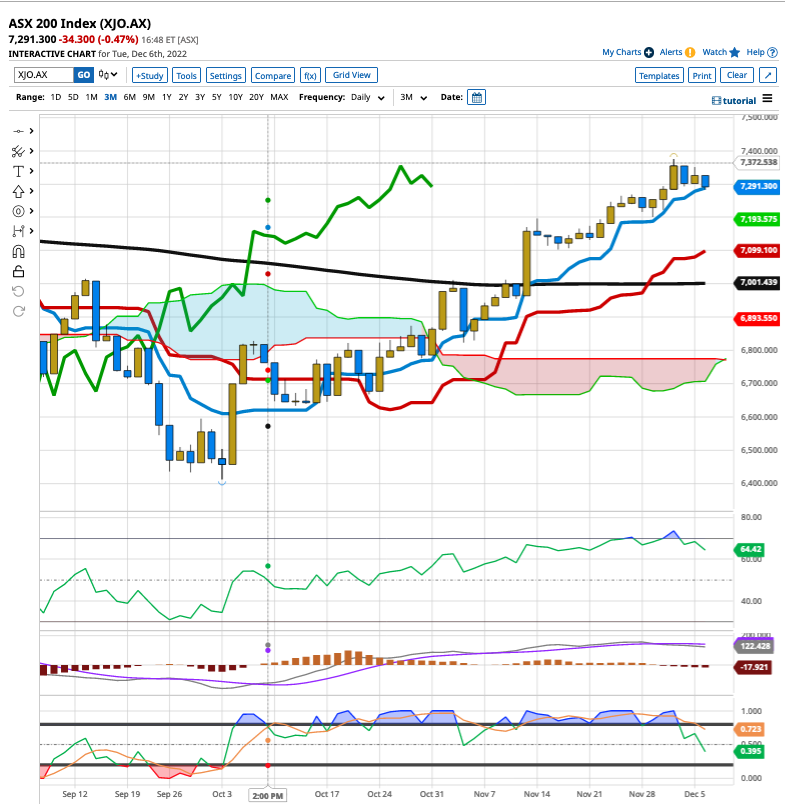
All that makes for a dreary start for the ASX.  After 20 minutes of trading, XJO is down about -0.4%.

Bitcoin.

Above is a Renko Chart for Bitcoin.  Renko Charts have the advantage of cutting out "noise" and trends can be easily see.  Bitcoin was down more than -1% last night.

Bitcoin is currently in a long term down trend, although consolidating at the lower end of the trend.

I would avoid until we can see signs of an up-trend developing.  

Sunday, December 4, 2022

Saturday, December 3, 2022

     4/12/22.  Sunday Report - The Week That Was.  Week Ended 2/12/22,

XJO Monthly Chart.


November was a strong month for the XJO, up +6.13%.

The down-trend in the Monthly Chart may have been reversed.

The Hull MA13 has turned up.  That's significant.  Remember that this was the first indicator to turn bearish back in October 2021.  

November ended above the 8-Month Exponential Moving Average.  Another bullish sign.  

The chart in December is knocking on resistance of the Supertrend (7/1.5).  That could cause the Index some problems.


XJO Weekly Chart.


In the past five days, XJO has risen +0.58%.  Until Thursday, the market was looking very strong, but it fell -0.72% on Friday which knocked the top off an otherwise very strong week.

Hull MA13 and the Supertrend Line are bullish.  The index has formed a double bottom.  Using a standard measure rule, that suggests the XJO will make a new all time high.

The Index is now well above the 50-Week MA which is a bullish signal.  Any pull-back will probably find support at the 50-WMA.


Weekly RSI is at 61.36, above 60 is often taken as a safe entry for a long-term bull market.  


XJO Daily Chart.


It is now time to tone down enthusiasm.  RSI reached 73.69 on Thursday - well above the overbought level of 70.  The index duly fell on Friday.

Expect consolidation or a pull-back in the near future.  Any dip will probably be bought.

SP500 Weekly Chart


The weekly SP500 chart isn't confirming the bullish state of the Australian market.  It remains in a down-trend with lower highs and lower lows.  Weekly RSI is at 53.69, so it remains below the critical 60 level.

Supertrend Line, 8-Week EMA and Hull MA13 have all turned up.  Those are bullish events.

SP500 has come up to the median line of the Andrew's Pitchfork - that often acts as resistance.  SP500 also lies beneath the 50-Week MA which may act as resistance.

Until I see a confirmed bull SP500, I'll remain a little cautious about the prospects for the Australian market.

ASX Sector Results for this week.


Six out of eleven sectors were up this week.  Materials (XMJ) did the heavy lifting for our market this week, up +4.14%.  The prospect of an improving economic situation in China with the possibility of a lifting of strict Covid quarantines probably had something to do with that.  But Financials (XXJ) also had a reasonable week, XXJ up 1%.  XMJ and XXJ are the two biggest sectors in the ASX.  When they both perform well, our market does well.

The big drag on the market this week was Energy (XEJ), down -3.15%.   XEJ has been in a medium-term down-trend since August.  It is now back to its 50-Day MA, so it is due for a bounce.  A decisive break below the 50-WMA could see it back down to test its 200-Day MA.

Relative Strength of Sectors.

RSI (Relative Strength Index) is calculated using the default setting of 14 days - almost three weeks of trading.  It provides a more reliable guide to changes in sectors than the one-week results which can jerk around quite a lot and, thus, RSI is probably a better guide to recent strength in the sectors. (Click here for a description of RSI.)


 Last week, nine out of eleven sectors were above the 60 level - a very bullish result.  This week, that has fallen to six out of eleven sectors are above the 60 level, so breadth has dropped off a little this week.  Only one sector (XEJ) is below the 50 level - so we still have a broad based bullish market, but easing a little.

XJO is just above the 70 level - expect a pull-back in the broad market.

NewHighs-NewLows Cumulative.


This is a lagging indicator but bullish signals are usually highly reliable.  

This is a metric for the long-term investor.  NH-NL Cumulative has hit right on its 10-Day MA this week.  A move above that level would be a signal for long-term investors to go long.

I've developed another metric StrongStocks-WeakStocks which is similar to NH-NL but gives signals a little earlier than NH-NL.


SS-WS is up for the fourth week in a row and has moved well above its 5-Week MA.   Four weeks in a row is a strong bullish result.

% of Stocks above key moving averages.

1.  % of stocks above 10-Day Moving Average: Last Week 75%, This Week 64%.  
2.  % of stocks above 50-Day Moving Average, Last Week 86%, This Week 85%.  
3.  % of stocks above 200-Day Moving Average, Last Week 58%, This Week 60%.  

Both the medium-term (%stocks above 50DMA) and long-term (%stocks above 200DMA) measures are bullish.  The short-term measure (%stocks above 10DMA) has pulled back a little this week as a result of Friday's big fall.  At 64% it remains bullish.


% of stocks above the 200-Day MA rose again this week.  It has been rising since mid-September.  Steady improvement can be seen in the bar chart and the 5-Week MA is rising.   This suggests we'll see 80% before we get a major pull-back.

Conclusion.
 
ASX had another positive move to the upside this week.  RSI hit well above 70 on Thursday - which is overbought.  That, and other indicators, suggest we could see a pull-back in the next week or so.  Any dip is likely to be bought given the strong basics of our market.

Stay Safe.

Friday, December 2, 2022

Finspiration Australia. Chart Analysis for Australian and International Stock Markets + Bitcoin.

 3/12/22.  Finspiration Saturday Report.

Yesterday in Australia.


XJO fell yesterday -0.72%.  For the past five days, it is up +0.58%.

Since 14 October, XJO has held in the upper half of the Bollinger Bands.  The trend is clearly headed up, but RSI was above 70 on Thursday - over bought, be wary of a trend change.


Last Night in America.

Marginal changes in major indices.  Banks down.  Stocks were well down early in trading after a better than expected employment report, but regained most of the lost ground during intra-day trading.


Dow Jones +0.1%.  SP500 -0.12%.  Nasdaq -0.18%.  Small Caps +0.4%.  Banks -0.99%.

SP500.


SP500 remains in an up-trend where it's been since mid-October.  It is up +1.13% in the past five days.

Momentum as shown on the MACD has flattened out.  So we may see a pull-back in the near future.

Commodities.


Commodities Index -1.06%.  Energy -2.09%.  Base Metals +1.94%. Agriculture -0.3%.  Gold -0.35%.

Bitcoin.


Bitcoin is in a short-term up-trend but still below the Supertrend Line (7/1.5).

Bollinger Bands are beginning to tighten up - expect some more consolidation and then watch for a big move - either up or down.


Finspiration Australia. 14/11/23. Tues. Morning Report.

Mixed Results in New York.  Energy up. NAB ex-dividend today. Dow Jones +0.16%.  SP500 -0.08%.  Nasdaq -0.11%.  Small Caps -0.07%.  Banks -0...