Monday Report. 5/12/22.
XJO up modestly today +0.33%.

XJO remains in an uptrend. Stay with the trend.
Monday Report. 5/12/22.
XJO up modestly today +0.33%.
4/12/22. Sunday Report - The Week That Was. Week Ended 2/12/22,
XJO Monthly Chart.

November ended above the 8-Month Exponential Moving Average. Another bullish sign.
The chart in December is knocking on resistance of the Supertrend (7/1.5). That could cause the Index some problems.
XJO Weekly Chart.


SP500 Weekly Chart

The weekly SP500 chart isn't confirming the bullish state of the Australian market. It remains in a down-trend with lower highs and lower lows. Weekly RSI is at 53.69, so it remains below the critical 60 level.
Supertrend Line, 8-Week EMA and Hull MA13 have all turned up. Those are bullish events.
SP500 has come up to the median line of the Andrew's Pitchfork - that often acts as resistance. SP500 also lies beneath the 50-Week MA which may act as resistance.
Until I see a confirmed bull SP500, I'll remain a little cautious about the prospects for the Australian market.
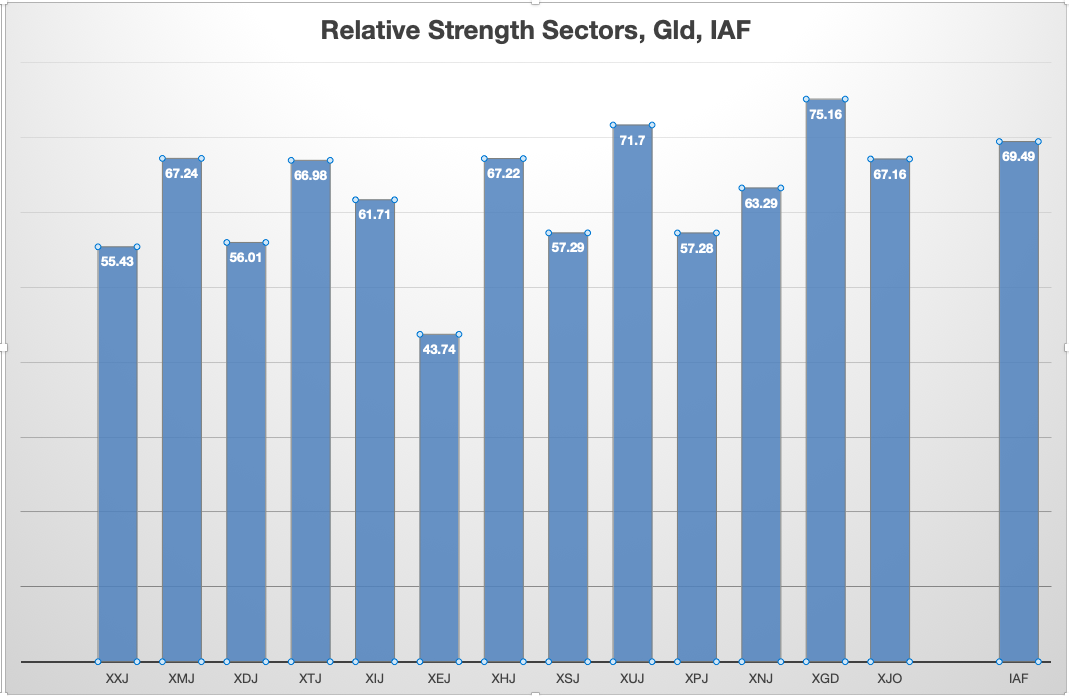
ASX Sector Results for this week.

Relative Strength of Sectors.
RSI (Relative Strength Index) is calculated using the default setting of 14 days - almost three weeks of trading. It provides a more reliable guide to changes in sectors than the one-week results which can jerk around quite a lot and, thus, RSI is probably a better guide to recent strength in the sectors. (Click here for a description of RSI.)
NewHighs-NewLows Cumulative.

This is a lagging indicator but bullish signals are usually highly reliable.
This is a metric for the long-term investor. NH-NL Cumulative has hit right on its 10-Day MA this week. A move above that level would be a signal for long-term investors to go long.
I've developed another metric StrongStocks-WeakStocks which is similar to NH-NL but gives signals a little earlier than NH-NL.

SS-WS is up for the fourth week in a row and has moved well above its 5-Week MA. Four weeks in a row is a strong bullish result.

3/12/22. Finspiration Saturday Report.
Yesterday in Australia.

Since 14 October, XJO has held in the upper half of the Bollinger Bands. The trend is clearly headed up, but RSI was above 70 on Thursday - over bought, be wary of a trend change.
Last Night in America.
Marginal changes in major indices. Banks down. Stocks were well down early in trading after a better than expected employment report, but regained most of the lost ground during intra-day trading.

SP500.

Momentum as shown on the MACD has flattened out. So we may see a pull-back in the near future.
Commodities.

Bitcoin.

Bollinger Bands are beginning to tighten up - expect some more consolidation and then watch for a big move - either up or down.
28/11/22. Monday Evening Report.
ASX lost ground today.
XJO down -0.4%.

Today's candle is a "spinner" which suggests a possible trend change.
Last Friday saw RSI above 70 which is overbought so we are probably see the start of a pull-back,
The 20-Day MA (centre line of the Bollinger Bands) is a likely target.
That coincides with the median line of the Andrew's Pitchfork. That's another sign of where the XJO is probably headed.
I'll be absent from the office for the next three days, so my next report will probably be Saturday.
In the meantime - stay safe.
27/11/22. Sunday Report - The Week That Was. Week Ended 25/11/22,
XJO Monthly Chart.

This week, the chart has finished above the 8-Month Exponential Moving Average. Another bullish sign.
If these gains can hold until the end of the month, we are entering a new bullish trend.
It is almost the end of the month, so I think we can confidently say that the long-trend has changed from down to up.
The chart is still below the Supertrend (7/1.5). That may act as resistance as it did for several months back in 2020.
Another bullish factor - Monthly RSI has moved back above 50. The last two times that happened after a bear market we saw a sustained bull market.
XJO Weekly Chart.


SP500 Weekly Chart

SP500 is lagging behind the XJO. It remains below the major down-trend line from Jan. 2022 and below the 50-Week MA.
Supertrend Line, 8-Week EMA and Hull MA13 have all turned up. Those are bullish events.
Weekly RSI is at 52.29 - above 50; but since the beginning of the year it hasn't been able to climb above 55. If Weekly RSI gets above 55, I think we can say the bear market in American stocks is over. Wait and see.
ASX Sector Results for this week.

Relative Strength of Sectors.
RSI (Relative Strength Index) is calculated using the default setting of 14 days - almost three weeks of trading. It provides a more reliable guide to changes in sectors than the one-week results which can jerk around quite a lot and, thus, RSI is probably a better guide to recent strength in the sectors. (Click here for a description of RSI.)

NewHighs-NewLows Cumulative.

This is a lagging indicator but bullish signals are usually highly reliable.
This is a metric for the long-term investor. While NH-NL Cumulative remains below its 10-Day Moving Average, it is best for long term investors to remain cautious and defensive regarding the market.
The gap between the NH-NL Cum and the 10-Day MA is narrow and is tantalisingly close to turning bullish.
I've developed another metric StrongStocks-WeakStocks which is similar to NH-NL but gives signals a little earlier than NH-NL.

SS-WS is up for the third week in a row and has moved well above its 5-Week MA. The 5WMA has turned up - that's a bullish sign. This is only the second time this year it has given a bullish signal. The first one didn't last for long (back in late March). Hopefully, we will get a solid run-up this time as we are into a bullish seasonal period.

26/11/22. Finspiration Saturday Report.
U.S. markets finish Thanksgiving Week on a mixed note.

DJ has been leading the market. RSI is now above 70 (overbought), be prepared for a pull-back.
SP500.

CCI is showing a negative divergence, so the next move is likely to be down.
Commodities.

There's not much in the Commodity figures for Australian resource stocks on Monday.
Bitcoin.

25/11/22. Finspiration Friday Morning Report.
Overnight, U.S. markets were closed for Thanksgiving. European markets were up: European Stoxx600 up +0.46%. German DAX +0.8%. French CAC +0.4%. London FTSE flat.
Yesterday in Australia, XJO up just +0.14%. This morning after 30 minutes of trading it remains flat, up +0.1%.

Stochastic RSI (bottom panel) is up in the "stress" zone. RSI is close to being overbought - be wary of a change in trend.
BHP is being threatened with strike action at its big Chile copper mine. Down -0.56% this morning.
In sectors, Energy (XEJ) is the biggest loser so far, down -0.95%. Info.Tech (XIJ) is doing best, up +0.82%. Financials (XXJ) up modestly +0.2%.
Mixed Results in New York. Energy up. NAB ex-dividend today. Dow Jones +0.16%. SP500 -0.08%. Nasdaq -0.11%. Small Caps -0.07%. Banks -0...


