4/12/22. Sunday Report - The Week That Was. Week Ended 2/12/22,
XJO Monthly Chart.

November ended above the 8-Month Exponential Moving Average. Another bullish sign.
The chart in December is knocking on resistance of the Supertrend (7/1.5). That could cause the Index some problems.
XJO Weekly Chart.


SP500 Weekly Chart

The weekly SP500 chart isn't confirming the bullish state of the Australian market. It remains in a down-trend with lower highs and lower lows. Weekly RSI is at 53.69, so it remains below the critical 60 level.
Supertrend Line, 8-Week EMA and Hull MA13 have all turned up. Those are bullish events.
SP500 has come up to the median line of the Andrew's Pitchfork - that often acts as resistance. SP500 also lies beneath the 50-Week MA which may act as resistance.
Until I see a confirmed bull SP500, I'll remain a little cautious about the prospects for the Australian market.
ASX Sector Results for this week.

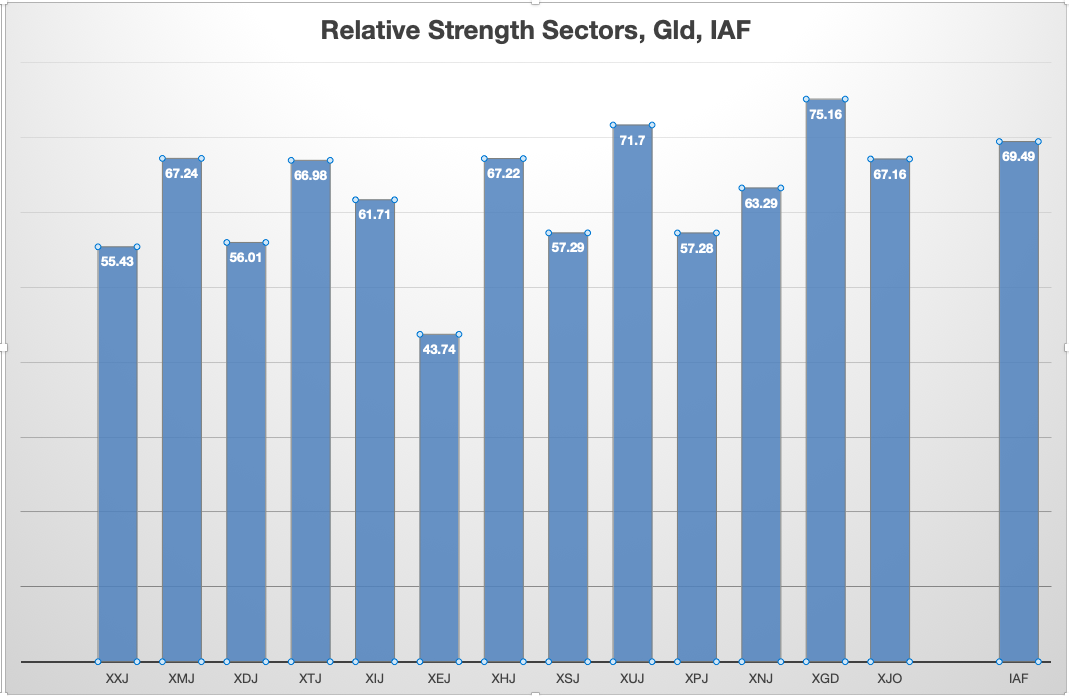
Relative Strength of Sectors.
RSI (Relative Strength Index) is calculated using the default setting of 14 days - almost three weeks of trading. It provides a more reliable guide to changes in sectors than the one-week results which can jerk around quite a lot and, thus, RSI is probably a better guide to recent strength in the sectors. (Click here for a description of RSI.)
NewHighs-NewLows Cumulative.

This is a lagging indicator but bullish signals are usually highly reliable.
This is a metric for the long-term investor. NH-NL Cumulative has hit right on its 10-Day MA this week. A move above that level would be a signal for long-term investors to go long.
I've developed another metric StrongStocks-WeakStocks which is similar to NH-NL but gives signals a little earlier than NH-NL.

SS-WS is up for the fourth week in a row and has moved well above its 5-Week MA. Four weeks in a row is a strong bullish result.


