Thursday, June 16, 2022

Finspiration Australia. Chart Analysis of Australian and International Stock Markets.

 16/6/22.  XJO finished flat today -0.15% after being up >1% in early trading.


Today was a reversal day - that's not uncommon as an Index searches for a "bottom".  Such action at the top of a trend is negative - at the bottom of a trend it suggests the opposite.

RSI14 is very oversold at 25.03.  We don't often see readings like that without a short-term rebound.

Breadth today was OK with 898 Advancing Issues and 583 Declining Issues.

Four Sectors were up today Energy +0.48%.  Materials +0.38%.  Communication Services +0.53%, and surprisingly, Property +1.2% (the best performing Sector).

GMG is the largest stock in the Property Sector.  It was up today +2.39%.


Positive Divergences, particularly on MFI, suggest the next move will be to the upside.  Watch.

Wednesday, June 15, 2022

Finspiration Australia. Chart Analysis for Australian and International Stock Markets.

 16/6/22.  Overnight.

The American Federal Reserve increased interest rate by +0.75%.  That didn't phase the market - that news was already priced into stocks.  European bonds had rallied earlier in the session sent sent Euro stocks higher, and the U.S. followed suit.


Dow Jones +1%.  SP500 +1.48%.  Nasdaq +2.5%.  Small Caps +0.88%.  Banks +1.58%.

SP500


SP500 rose yesterday after leading indicators like MACD and Histogram were showing positive divergences.

Stochastic is lifting up but still in the oversold range.  A rise above 20 would give a short-term buy signal.

Commodities.

Commodities Index flat +0.07%, after Energy fell -0.47%, but Base Metals up strongly +1.97%.  Agriculture also flat +0.05%.  Gold up +1.31%.

Iron Ore down -2%.  Thermal Coal +0.7%.

Overnight oz Futures +0.3%.  That looks relatively pessimistic.

Finspiration Australia. Chart Analysis for Australian and International Markets.

 XJO down today -1.27%.


The above chart is a weekly chart for XJO.  It is clearly bearish and broke below a major support level today.

Here's the daily chart for the XJO.


Yesterday, XJO completed a bearish Head/n/Shoulders formation and continued lower today.

Here's the projection for the current Head/n/Shouders top:


I'm not particularly confident in H/n/S Top projections.  But it is what it is.  The projection suggests a bottom for this pull-back of 6248.  XJO finished today at 6601.  That suggests another -5.3% to the downside.

Today started with a downside move, then a rebound.  The Fair Work Commission then announced a wage rise of 5.2% for minimum wage earners.  No one can begrudged them that, but the XJO saw lower profits, so it fell.  After stabilising, the market went into reverse gears at 1.25 p.m.  Why?  No idea.  But here's the intra-day chart:


The XJO remains bearish - don't buck the trend.


Finspiration Australia. Chart Analysis of the Australian and International Stock Markets.

 Special Edition for Bitcoin.


Bitcoin has formed a large double top.  Standard Measure Rule suggests Bitcoin will go below zero.  That seems a bit extreme.  (Understatement of the year.). 5000 seems like a reasonable target based on support levels.

Finspiration Australia. Chart Analysis for Australian and International Markets.

 Here's a special on Bitcoin.


Bitcoin has formed a clear double top.  A standard measure rule suggests Bitcoin will go below zero.

Well - that seems a bit extreme, but a fall to near zero does seem possible.  US$5000 anyone?


Tuesday, June 14, 2022

Finspiration Australia. Chart Analysis of Australian and International Stock Markets.

15/6/22 Mixed Results in the U.S.


Dow Jones -0.5%.  SP500 -0.38%.  Nasdaq +0.18%.  Small Caps -0.27%.  Banks -0.92%.

SP500.


Momentum to the downside is slower.  Momentum must slow before the Index can reverse to the upside.

Positive divergences on MACD and Money Flow Index suggest a move to the upside is coming soon.

Commodities.


Commodities remain bearish.  Commodities Index -1.1%.  Energy -1.11%.  Base Metals -1.7%.  Agriculture -0.28%.  Gold -0.8%.

Iron Ore -0.9%,  Thermal Coal -1.8%.

After 15 minutes of trading this morning, XJO is down -0.6%.

Finspiration Australia. Chart Analysis of Australian and International Stock Markets.

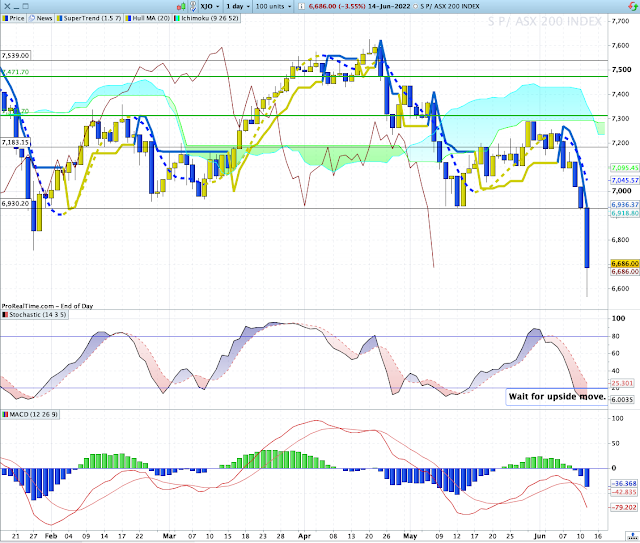
 XJO down -3.55% today after being down about -5% in early trading.

Below is a weekly chart for XJO:


Today's action took the XJO down to an old congestion zone from early 2021.  It is likely that will provide support for the Index.

Here's today's daily chart:


It's likely that today's extreme move to the down-side was a "wash-out" day.

XJO chart still has double divergences on MACD and Histogram - a pointer to an upside move in the near future.

A move up on Stochastic would suggest a short-term buy signal.

Today's new 52-Week Lows hit a number not seen since the bear market of March 2020.  New Lows hit 465.  The worst day in March 2020 saw a figure of 518 on 13 Mar, 2020.  But the bear market in Mar. 2020 saw four days >350, so we could see more damaging figures in the near future.

Here's a longer time-frame weekly chart for the XJO:


We can see that the current fall in the XJO is dwarfed by the bear market of 2020.  That was caused by the fear of the Covid pandemic.  The current fall has occurred because of interest-rate raising by Central Banks around the world.  Until we see some easing in inflation expectations and the rate at which interest is raised by Central Banks, we can probably see more falls.

Finspiration Australia. 14/11/23. Tues. Morning Report.

Mixed Results in New York.  Energy up. NAB ex-dividend today. Dow Jones +0.16%.  SP500 -0.08%.  Nasdaq -0.11%.  Small Caps -0.07%.  Banks -0...