XJO down -3.55% today after being down about -5% in early trading.
Below is a weekly chart for XJO:
Today's action took the XJO down to an old congestion zone from early 2021. It is likely that will provide support for the Index.
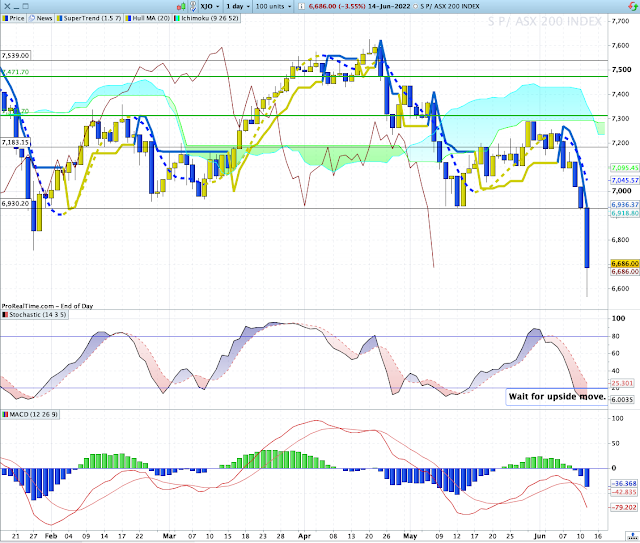
Here's today's daily chart:
It's likely that today's extreme move to the down-side was a "wash-out" day.
XJO chart still has double divergences on MACD and Histogram - a pointer to an upside move in the near future.
A move up on Stochastic would suggest a short-term buy signal.
Today's new 52-Week Lows hit a number not seen since the bear market of March 2020. New Lows hit 465. The worst day in March 2020 saw a figure of 518 on 13 Mar, 2020. But the bear market in Mar. 2020 saw four days >350, so we could see more damaging figures in the near future.
Here's a longer time-frame weekly chart for the XJO:
We can see that the current fall in the XJO is dwarfed by the bear market of 2020. That was caused by the fear of the Covid pandemic. The current fall has occurred because of interest-rate raising by Central Banks around the world. Until we see some easing in inflation expectations and the rate at which interest is raised by Central Banks, we can probably see more falls.


No comments:
Post a Comment