Weekly Wrap - Week ending 10 June, 2022.
XJO Monthly Chart.
XJO is only ten days into a new month (June).
The monthly chart remains range bound 6930-7539, but now at the lower edge of that range. XJO finished Friday at 6932
The chart is is essentially sideways as indicated by the two flat Supertrend lines, one above and one below the monthly candles.
The MACD Histogram has fallen this week to the down-side, indicating that momentum is to the downside.
Weekly Chart.
XJO This week, XJO has its worst week since April, 2020, down -4.24%. That broke a three week positive run.
The chart is range bound, in concert with the monthly chart, but clearly at the lower end of the range
Medium term, the chart remains bearish.. Hull MA13 is blue (bearish); two Supertrend lines are blue (bearish) and the chart is just below the 8-Week EMA (bearish). RSI and CCI are below their mid-lines (bearish). MACD Histogram is falling - momentum to the downside is increasing.
The chart is, however, rising from the lower edge of the range
Last week XJO finished at 7239, this week it finished at 6932.
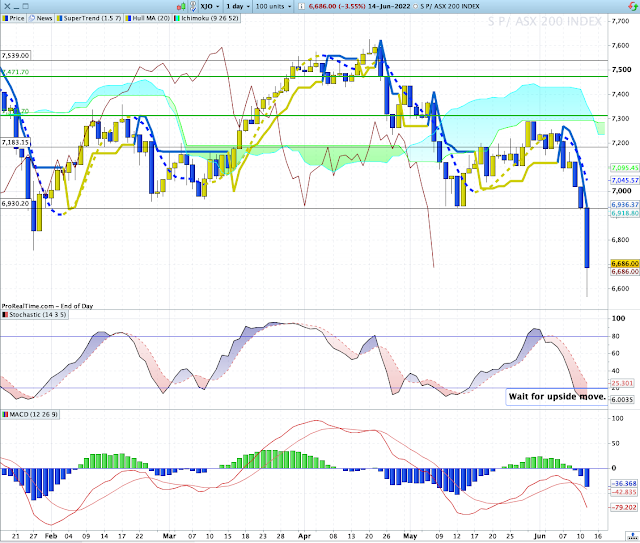
Daily Chart.
Both Supertrend Lines are bearish, Hull MA13 is bearish; Chart is below the 8-DEMA which is bearish.
On the bright side, there is a double positive divergence on the MACD histogram and the MACD itself.
That has a reasonably reliable leading indicator. It suggests that the Chart will move up in the coming week.
ASX is closed on Monday, 13 June for Queen's Birthday celebrations in the southern states. So our market might escape the catastrophic fall in the U.S. on Friday if the U.S. bounces on Monday.
The ASX this week was knee-capped by a huge fall in Financials, down -9.01% after the Reserve Bank raised interest rates by more than expected +0.5%.
I'm a bit perplexed by the fall in the Financial Sector. Rising interest rates are supposedly good for Banks as they can increase margins. So the "big boys" who control the market must be assuming that economic activity will be so poor that will impinge on banks, and, possibly, they are expecting a large number of customers to fail in their loan repayments.
In yesterday's post, I looked at ANZ, one of the four big banks which dominate the Financial Sector. That examination was hopeful of a rebound in ANZ, which would be reflected in the other three big banks. So we may have seen the worst of the falls in Financials, at least in the short-term
SP500.
On Friday night, SP500 gapped down at the opening and continued falling to finish down -2.91%.
That move takes the SP500 down into a support zone from which it has bounced several times in the past. After such a big fall, it is likely that SP500 will bounce again.
Sector Changes - past week.
This chart shows the performance of each sector (plus Gold Miners, XJO, BEAR and IAF) over the past week.
Two sectors up, one flat and eight down. The best was Energy XEJ +4.97%, followed by Utilities XUJ +0.46%. Energy fell heavily on Friday, down -1.64%. It's run up might be coming to an end.
Financials (XXJ -9.01%) is the biggest sector in the market and a major drain on the performance of the XJO this week. Not far behind is Real Estate XPJ -7.67%. XPJ is an interest rate sensitive sector, so the big fall in XPJ is understandable. The other sector highly sensitive to interest rate movements is Information Technology -4.81%.
New Highs - New Lows Cumulative.
This is one of the important breadth indicators. Unless breadth is solidly positive, the market is always under threat.
NH-NL Cumulative continues to fall and is now well under its 10-Day Moving Average, that's a big red danger sign for long-term investors.
ASX Advance-Decline Line.
This is another important indicator of breadth.
ASX Advance-Decline Line is also bearish, and in sync with NH-NL Cum.
% of Stocks above key moving averages.
1. % of stocks above 10-Day Moving Average: Last Week 53%, This Week 17%.
2. % of stocks above 50-Day Moving Average, Last Week 31%, This Week 18%.
3. % of stocks above 200-Day Moving Average, Last Week 38%, This Week 29%
This is another indicator of weak breadth.
Once these instruments fall below 20, that's a contrarian signal that the market might bounce. Two out of three instruments are below 20. It would be even stronger if the third one was below 20, but we are looking at a very weak oversold market, so the chance of a bounce is good.
I don't think there's any point in jumping the gun, if we're reaching an inflection point in the market, there'll be plenty of time to hop on a new trend.
Seasonally, we often see a medium term up-trend in stock markets. I'd wait and see how this pans out.
Conclusion.
1. Monthly, Weekly and Daily Charts are at the lower end of their ranges. I could speculate that we'll bounce here, and there is some evidence for such a view, but jumping the gun could be dangerous move.
2. Breadth is poor, so poor that contrarians will be salivating at the prospect of new buying coming into the market. Contrarian signs are not always reliable, and sometimes well ahead of what could happen.
3. We need to see a move up on the Stochastic Daily chart.
4. Double positive divergence on MACD and its Histogram point to the possibility of a move to the upside.


