Friday, May 20, 2022

Finspiration Australia. Chart Analysis for Australian and International Stock Markets.

21/5/22.  Yesterday In Australia. 


Strong day on the XJO yesterday, up +1.15%.  XJO has now formed a higher low.  We still need to see a higher high to meet the definition of an up-trend.

Tenkan Sen (Conversion Line - Blue) is now acting as support for the XJO.

Overnight.

Dow Jones +0.3%.  SP500 +0.01%.  Nasdaq -0.3%.  Small Caps -0.37%.  Banks -0.06%.

Flat finish in the U.S. after intra-day buying erased most of the early buying and producing "hanging man" candlesticks on all of the above indices.  That often occurs at or near the end of down-trends.

SP500.


SP500 continues to sketch out a possible bottom for this down-trend.  Positive Divergence on CCI gives further optimism to that view.

Any rally is likely to be a counter-trend rally until proven otherwise.
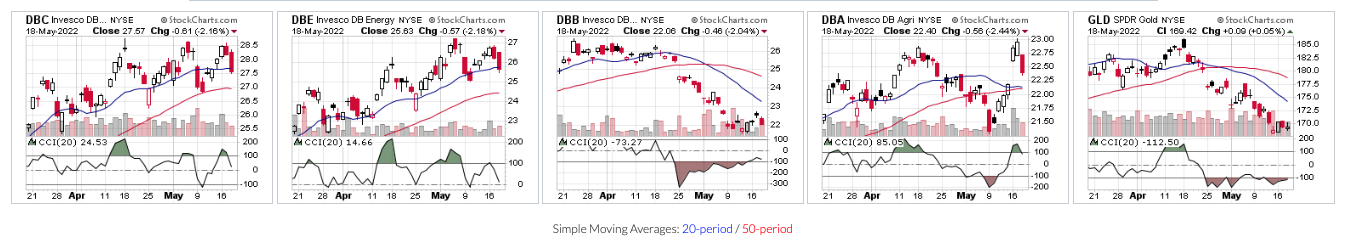
Commodities.

Commodities Index +0.14%.  Energy +0.62%.  Base Metals +0.31%.  Agriculture -0.67%.  Gold flat +0.07%.

NY Advance-Decline Line.


NY A-D Line remains in a down-trend.  Stay defensive until we see this change to an up-trend.


Thursday, May 19, 2022

Finspiration Australia. Chart Analysis for Australian and International Stock Markets.

20/5/22.  Overnight.


 Dow Jones -0.75%.  SP500 -0.58%.  Nasdaq -0.26%.  Small Caps -0.49%.  Banks -0.45%.

SP500.


SP500's candle last night was a doji spinning candle, so it could be sketching out a double bottom.  It still has a lot of work to do to confirm that, but it does look promising.

Commodities.


Commodities Index+1.27%.  Energy +1.13%.  Base Metals +3.54%.  Agriculture -0.04%.  Gold +1.47%.

Iron Ore +0.9%.  Thermal Coal flat 0.0%.

After 20 minutes of trading this morning, XJO is up 0.6%.  So it looks like a strong day today going against the trend set by America last night.

Finspiration Australia. Chart Analysis of Australian and International Stock Markets.

 19/5/22.  After big falls in the U.S. last night, Oz market down heavily today, -1.65%.


The short-term trend is undecided, with two Supertrend Lines positive and one negative.

Hull MA13 remains positive.

The past few days have seen a drop off in Volume.


This suggests that the retail traders are largely finished their selling and sitting out of the market - or just holding on.  The market is now largely the play-thing of the big institutions, so, if we see a rebound, it should be significant.

Until we see an improvement in breadth, stay defensive.  (See charts below.)


Wednesday, May 18, 2022

Finspiration Australia. Chart Analysis for Australian and International Stock Markets

Welcome to new reader from Russia.

19/5/22.  It was ugly on Wall Street last night. 


U.S. Indices.


Dow Jones -3.57%.  SP500 -4.04%.  Nasdaq -4.73%.  Small Caps -3.19%.  Banks -2.89%.

SP500.


Two Blue Supertrend lines and one Yellow.  (Two bears and one bull.). Until we see all yellow it's best to stay defensive.

Commodities.


No joy for traders in Commodities last night.

Commodities Index -2.16%.  Energy -2.19%.  Base Metals -2.04%.  Agriculture -2.44%.  Gold +0.05%.

Iron Ore -1.3%.  Thermal Coal -0.4%.

Overnight Oz Futures -1.9%.

Finspiration Australia. Chart Analysis of Australian and International Stock Markets.

 18/5/22.  XJO up strongly today.


XJO up today +0.99%.  We now have four days to the upside.  XJO is now coming up to the last of three Super-trend lines.  That might provide some resistance.

In a return to form, Materials (XMJ +2.5%) was the top performing Sector.  Consumer Staples (XSJ -1%) was the worst performer and the only Sector to record negative figures.

Here's the XMJ Chart:


The correlation of XMJ and XJO is clear in this chart.  XMJ has risen above two Super-trend lines and approaching the third one.  That might cause a consolidation or pull-back.

I've calculated a turn-date of 26 May.  So we can expect more upside in the medium term, but not before we see some consolidation and then a move to the upside.

Below is a different type of chart suggesting that the current move is a counter-trend rally:


This chart shows the Ichimoku indicators.  

XJO has only just moved into the Ichimoku Cloud - that's a neutral or no-trade zone.

We need to see XJO get above the Ichimoku Cloud before being confident of a bullish medium-term trend. 


Tuesday, May 17, 2022

Finspiration Australia. Chart Analysis for Australian and International Stock Markets.

18/5/22.   Overnight.


Dow Jones +1.34%.  SP500 +2.02%.  Nasdaq +2.76%.  Small Caps +3.02%.  Banks +3.9%.

Euro Stoxx50 up +1.52%.

Despite the current rally, all of the above remain in a down-trend.  An up-trend can be declared when we see a higher high and a higher low.

SP500.


Two out of three Super-trend Lines have now switched to yellow (bullish).  Hull MA13 has switched to yellow (bullish).

Divergences on CCI are a leading indicator for a short-term trend change.  See Above.

Commodities.


Commodities Index -1.09%.  Energy -2.09%.  Base Metals +1.26%.  Agriculture +0.53%.  Gold -0.63%.

Iron Ore -0.7%.  Thermal Coal +2.8%.

Overnight Oz Futures +0.9%.

Overnight in the U.S., BHP up +3.25%, RIO +3.59%, Woodside +1.99%.

Finspiration Australia. Chart Analysis for Australian and International Stock Markets.

 17/5/22.  XJO up modestly today.


The first of three Supertrends has switched to bullish (yellow) and Hull MA13 has also switched from down to up (yellow=bullish).

Those are short-term signals suggesting that shorts should close out their positions at the end of trade.  Intrepid traders can go long.  I'd prefer to wait until we see all three Supertrends go yellow before taking a position.

Best sector today was Energy +2.09%.  The Ukraine War continues to dominate the Energy market.

In the short-term I remain bullish.  But this still looks like a "sell-the-rallies" market.

Finspiration Australia. 14/11/23. Tues. Morning Report.

Mixed Results in New York.  Energy up. NAB ex-dividend today. Dow Jones +0.16%.  SP500 -0.08%.  Nasdaq -0.11%.  Small Caps -0.07%.  Banks -0...