Friday, May 6, 2022

Finspiration Australia. Chart Analysis of the Australian and International Stock Markets.

 No reports for a couple of days.  On Thursday afternoon, my computer "froze" and when I tried to restart it I got the dreaded "black screen", aka the "death screen".  I visited the good folk at the Genius Bar, Apple Store, Chermside on Friday afternoon, they got me going again.  

Yesterday in Australia.

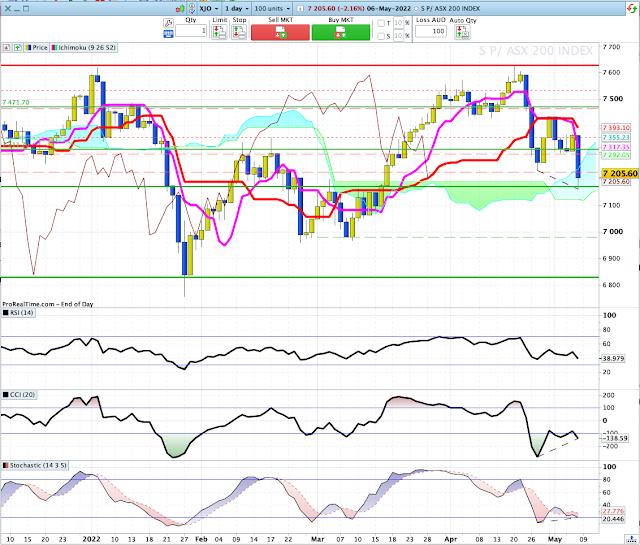
Yesterday, XJO down -2.19%.  That's the biggest down day since 24 February, when XJO was down -2.99%.

In late December, 2021 and January 2022 the XJO had three down days of more than -2%.

CCI and Stochastic are both showing positive divergences.  They don't mean a lot until we get a good upside day.  In the meantime, stay defensive.

Overnight in the U.S.


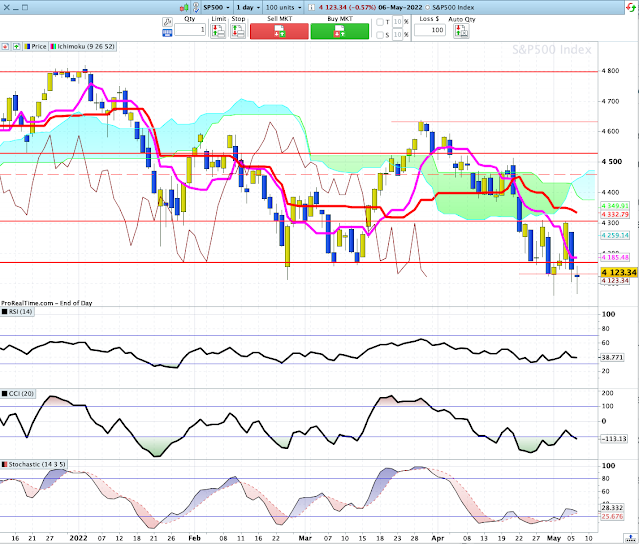
Dow Jones -0.3%.  SP500 -0.57%.  Nasdaq -1.4%.  Small Caps -1.06%.  Banks -1.06%.

Indices are respecting the down-sloping 20-Day MA as resistance.

SP500.


Intra-day buying is evident in the long lower tail on the last candle on this chart.

SP500 seems to have found support at Monday's low, so there's a good chance we will see an upside bounce here.

That notion is supported by the positive divergences on the three indicators in the lower panes.

Commodities.


Commodities Index +0.11%.  Energy +0.86%.  Base Metals -2.37%.  Agriculture -1.22%.  Gold +0.17%.

Those base metals prices are poor for our miners on Monday.  CCI is showing a good positive divergence, so this pull-back might be coming to an end.

New York A-D Line.


NY A-D Line remains in a bear trend.  Until that improves, stay defensive. 

Wednesday, May 4, 2022

Finspiration Australia. Technical Analysis of Australian and International Stock Markets.

 5/5/22 (Cinqo de Mayo).

Overnight:  Whooshka!


Dow Jones +2.81%.  SP500 +2.99%.  Nasdaq +3.19%.  Small Caps +2.66%.  Banks +3.35%.

America's Federal Reserve raised interest rates by +0.5%, with more of the same to come.

It's not the news that matters but the market's reaction to the news that matters!  And last night - the market went WHOOSHKA after the dreaded +0.5% interest rate happened.

This looks to me like a continuation of the reversal day on 2/5/22 which trapped a lot of traders on the short side of the market.

SP500.


That is a huge jump in the SP500 which suggests plenty of institutional money behind the move.

The positive divergences seen on indicators is now playing out in stocks.  

The index is now at a horizontal resistance level, so we might see some consolidation now, but further upside can then be expected.

Below is a one-year chart of SP500:


W.D. Gann the legendary early 20th Century trader often looked for major turning points one-year after a major low.  The low on 2/5/22 at 4062.5 is just a few points away from the low on 12/5/21 at 4056.9.  Extra-ordinary.  Co-incidence?  Maybe, maybe not.


Above is a 5-year chart of SP500 with a Fibonacci Fan drawn from the low in Mar.  2020 to the top in Jan. 2022.  The current pull-back has stopped almost exactly at the 38.2% retracement level.

Another coincidence?  

These types of coincidences(?) are often looked for by big traders.  

Just suggestions that the current pull-back is over.

The intrepid can now go long - despite the old saying, "Sell in May - go Away."

Commodities.

Commodities Index +3.12%.  Energy +4.14%.  Base Metals +2.5%.  Agriculture +0.91%.  Gold +0.98%.

Iron Ore -0.5%.

Overnight Oz Futures up +0.5%.  That seems a somewhat muted response compared to the American rises, but we might do better than that today.


Finspiration Australia. Technical analysis of the Australian and International Stock Markets.

 This morning I had some serious computer problems which took some hours to rectify - so there was no morning report this morning.  If any of you have experience the "black screen" on a MAC you will understand the difficulties I experienced this morning.  ðŸ’€

4/5/22.  XJO down modestly today -0.16%.


XJO started positively this morning but quickly gave up those gains.

Tenkan Sen has now fallen below Kijun Sen which suggests further downside.

Breadth continued to deteriorate.


NH-NL Line


Until we see an improvement in breadth, there's not much point in expecting a solid move to the upside.

Stay defensive.

Tuesday, May 3, 2022

Finspiration Australia. Technical Analysis of the Australian and International Stock Markets.

 3/5/22.  Reserve Bank Interest Rate Announcement - XJO down moderately today -0.42%.


Until the RB announcement at 2.30 p.m., XJO traded in a choppy fashion and was more or less flat when the announcement came out.  It then fell but recovered some of the loss to finish down moderately.

The two main lines of the Ichimoku system (Tenkan Sen and Kijun Sen) are locked together indicating a non-trending market.  If Tenkan Sen (blue line) falls below Kijun Sen (red line) we'll have a sell signal.

I was a little surprised by the market's reaction to the RB announcement.  A 0.25% rise was expected.  Probably the death knell in the announcement was the statement showing that this well be the first of several interest rate rises to come.

Breadth was poor.  The breadth charts I showed in last night's blog have deteriorated further.  Stay defensive.

A-D Line:


NH-NL Cumulative


Monday, May 2, 2022

Finspiration Australia. Technical Analysis of the Australian and International Stock Markets.

3/5/22.   U.S. equities finish higher.


Dow Jones +0.26%.  SP500 +0.57%.  Nasdaq +1.63%.  Small Caps +0.72%.  Banks +1.11%.  Except for the Banks, CCI on the other indices are all showing positive divergences.  That suggests we will see a counter-trend move in the near future.

U.S. indices were well into negative territory with an hour of trading to go.  A surge higher in the last hour pushed the indices into positive territory with the Nasdaq up very strongly, despite 10-Yr Treasuries rising above +3%.

SP500.

Last night's candle is a "hanging man" which often comes at the end of a trend.  

The action last night was particularly interest.  SP500 broke below the low of 24 February, which was the lowest low in over a year.  The last hour action pushed the index well above that low.

The fall in the earlier part of the day below the low of 24 February would have triggered a lot of sell orders.  Those sell orders are now stranded and this could lead to a short-covering rally.  Let's see if that eventuates tomorrow.  This action is typical of "smart money" activity.  

Commodities.


Commodities Index +1.53%.  Energy +3.51%.  Base Metals -1.39%.  Agriculture -0.36%.  Gold -1.95%.

The most recent candles on both Base Metals and Agriculture are "hanging man" candles.  The one on Base Metals is accompanied by increased volume.  That could be a sign that the pull-back in Base Metals is ending.

Iron Ore - no new figures for IO as China has shut down for May Day Celebrations.

Overnight Oz Futures are down -0.4%.  They are probably being constrained by fear about an interest rate hike by the Reserve Bank.  Federal Reserve also meets this week.

I'm reasonably optimistic that the ASX will finish in positive territory today - but the Reserve Bank announcement will be key.


Finspiration Australia. Technical analysis of the Australian and International stock markets.

 2/5/22.  ASX200 down heavily today -1.18%.


Today's candle, a bearish engulfing candle, took out all of the gains achieved on Friday.

Indicators are indecisive.  Hull MA13 remains in a down trend.  Supertrend 91.5/7) remains bullish after Friday's good result.

Conversion Line and Base Line on the Ichimoku System are both tracking sideways - indicating no trend.

Wait until we have more decisive signals from the chart.

Breadth was poor today with both Advances-Declines and NewHighs-New Lows both showing clear downside moves.

Advances-Declines Cumulative;


NH-NL Cumulative.


Until we see some positive action in these breadth indicators, it's best to stay defensive.

Historical Volatility is rising above Implied Volatility.  This is another indication of a bearish market.


Historical Volatility is the blue line, Implied Volatility is the red line.  When Historical rises above Implied, it usually means the market is short-term bearish.

Friday night's humungous drop in the U.S. is unlikely to be repeated tonight.  So we could have a positive day in Australia tomorrow.

Tomorrow will bring the Reserve Bank's interest rate announcement.  Most economists are expecting an interest rate rise.  That would be the first rise since 2010.  A rise is probably priced into the market, but the size of the rise could spring a surprise.  

It should be an interesting day tomorrow on our market.


Saturday, April 30, 2022

  Weekly Wrap - Week ending 29 April, 2022.

XJO Monthly Chart.


March was a good month for the XJO, up +6.39%.   April has settled back a little, down -0.66% for the month.  Despite that fall, the 8-Month EMA and Hull MA13 remain bullish.  That's a good long-term guide for investors.  It's not without qualification, as I show later in the report.

Weekly Chart.


XJO was negative this week, -0.51%, the second down week in a row.  

The long tail on the weekly candle shows strong buying during the week after an early fall.

It remains above the 8-Week EMA. Supertrend (1.5/7) and  Hull Moving Average remain bullish.  

Daily Chart.


This week was a short four-day week due to Anzac Day.  The previous Friday was very weak and that carried over into Tuesday and Wednesday.  Thursday and Friday rebounded but not enough to cancel out the falls on Tuesday and Wednesday.

Indicators are indecisive with Supertrend (1.5/7) turning bullish, but Hull MA13 remains bearish.  Overhead resistance is at 7472 and then major resistance at 7628.  Given events in America on Friday night (SP500 -3.63%) our market will fall at least 1% on Monday.

Using multiple time-frame analysis, Monthly and Weekly XJO remain bullish.  Daily XJO is indecisive and out of sync with the Monthly and Weekly Charts..  Wait for all time frames to get back in sync before re-entering the market.

XJO and SP500 compared.


The chart above shows the performance of the SP500 (America - blue and grey candles) with the XJO (Australia - yellow and blue candles) over the past 100 trading days.

The two indices were more or less in sync from early December to early February.  They then tended to diverge.  There is still a degree of correlation, but we can see that the Australian market is well ahead of the American market.

The Australian and American stock markets are very different beasts.  The Australian market is dominated by miners and financial services, while the American market is dominated by technology stocks.  Technology stocks tend to be heavily leveraged, so they tend to do less well in environment where interest rates are rising.  Hence the divergence in the two particularly in the past month. 

Sector Changes - past week.


This chart shows the performance of each sector (plus Gold Miners, XJO, BEAR and IAF) over the past week.  XJO was down -0.51%.  Five sectors were up and six down.  Unfortunately, among the six down sectors were the two biggest sectors, Financials (XXJ -0.7%) and Materials (XMJ -1.14%).

As a general rule, look for stocks in the best sectors and avoid stocks in the worst sectors.  For example, look to Utilities (XUJ), Industrials (XNJ) and Property (XPJ) for stocks to buy.  Avoid Information Technology (XIJ), Materials (XMJ).  (Exceptions to that general rule could occur.)  XUJ is now very overbought and probably not a serious contender for current buying - look to buy the dip.

Materials


A major driver of the Australian market has been the Materials Index which can be quite volatile as the above chart shows.  On Tuesday, XMJ hit its oblique support level and rebounded.  A break down through that oblique support level could see a serious decline in XMJ affecting the broad market.


New Highs - New Lows Cumulative.

NH-NL Cumulative is in a consolidation phase and has tipped well under its 10-Day Moving Average, that's a caution sign for long-term investors.  It continues to deteriorate and should be taken seriously by long-term investors.  Look to take a defensive stance in the market.


% of Stocks above key moving averages.

1.  % of stocks above 10-Day Moving Average, 57%.
2.  % of stocks above 50-Day Moving Average, 65%.
3.  % of stocks above 200-Day Moving Average, 57%.

All three are above 50% level - which confirms the bullish status of the ASX

Bonds versus Stocks.


At the end of the week, Stocks had an advantage over Bonds, but only just.  This is a chart of relativities, not absolutes.  

The relativity has weakened with the chart now below its 10-Day MA.  At this stage, at the end of the week, stocks have a slight relative advantage over bonds.  But the case for stocks over bonds is weakening.


Offence or Defence?


The above chart compares the performance of XSJ Consumer Staples (yellow and blue candles) with XDJ Consumer Discretionary (blue and grey candles).  

If consumers are confident about the economy, they are usually happy to splurge on big ticket, discretionary items - companies such as Harvey Norman, JB Hi-Fi and car retailers.  If consumers are not so confident about the economy, consumers tend to delay buying big ticket items.  

Consumer Staples are much more resilient to lack of confidence in the economy.  While they may delay purchasing a new refrigerator or Apple computer, consumers will still buy toilet paper and breakfast cereal.  In Australia, big retailers like Woolworths and Coles dominate the Consumer Staples market.

We can see in the above graph, that XDJ and XSJ were more or less in sync until February this year, when XSJ chart began to dominate the XDJ chart.  

That suggests that investors need to take on a more defensive posture than they had last year.

Conclusion.

1.  The monthly, weekly and daily charts are out of sync.  While they remain out of sync, it's best to wait till then are back in sync (all bullish) before committing more money to the market.

2.  XSJ/XDJ suggests a defensive posture in investments.

3.  Negative correlation between the NH-NL Line and the XJO may be predicting further falls in our market.

4.  Price action on the last two days of the week, but a very negative result in the U.S. on Friday night suggests we could see some serious falls coming up in the next few days.

5.  Materials (XMJ) was one of the mainstays in our market for the past few months.  A break lower below its oblique support line could result in major falls in our broad market.

Stay defensive until the market conditions improve.
Finspiration Australia. 14/11/23. Tues. Morning Report.

Mixed Results in New York.  Energy up. NAB ex-dividend today. Dow Jones +0.16%.  SP500 -0.08%.  Nasdaq -0.11%.  Small Caps -0.07%.  Banks -0...