Wednesday, April 6, 2022

Finspiration Australia. XJO down but not out.

 At one stage today, XJO was down -1.2%, but finished down -0.5%.  It clawed its way back off the canvas after receiving a knock-out blow in the early period of trading.

XJO fell below a couple of major supports, the 8-Day EMA and horizontal support but finished above both of those today.  Not a bad effort.

But, we do have the first real evidence of a pull-back with the Hull MA13 switching from yellow to blue, i.e. bearish.  That's the most short-term indicator on the index chart.

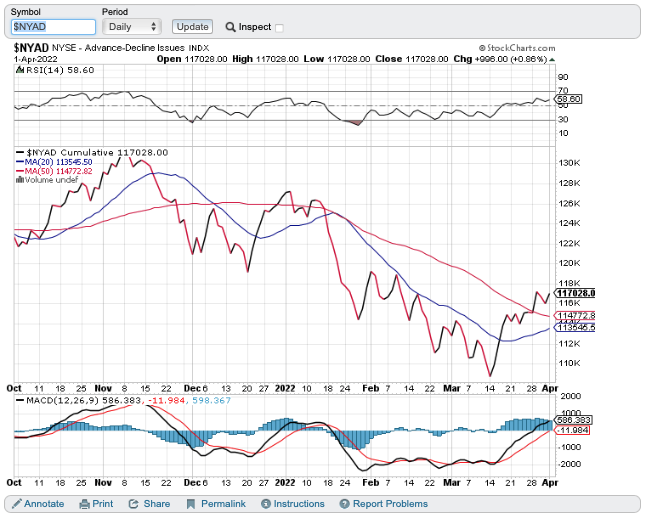
RSI has turned down and the CCI has been falling since mid March.  It is often early but rarely wrong.

Best performing sector today was Financials (XXJ) up +0.7%.  Without that, it would have been carnage on our market today.

In early overnight trading, Europe is down, Germany about -1% and UK -0.2%.  That may not be a good indicator of what will finally happen tonight as the Europeans are following the negative results rolling around the globe after the U.S. fell last night.  It all depends on the U.S. tonight.  But the intra-day buying in Australia was a positive.


Tuesday, April 5, 2022

Finspiration Australia. U.S. stocks and bonds both down. 6/4/22.

 Overnight.


Dow Jones -0.8%.  SP500 -1.26%.  Nasdaq +2.26%.  Small Caps -2.26%.  Banks -1.01%.

SP500.

Tuesday's fall eclipsed the good rise on Monday.  SPX has broken below the first line of support, the Tenkan Sen (Conversion Line).  Plenty of support lies nearby, the 200-Day MA and the top of the "Cloud".

Commodities.


Commodities Index -0.82%.  Energy -1.71%.  Base Metals +0.12%.  Gold -0.63%.

Iron Ore -0.2%.

Overnight Oz Futures -0.7%.

ASX should open on a weak note today.

Finspiration Australia. XJO up today but suffers late-day sell-off.

XJO up today +0.19%.


 XJO saw a lot of intra-day selling in the afternoon.  That continues a series of doji candle sticks which suggest this is a topping pattern.

The XJO starting falling around 2.30 p.m. announcement by the RBA of its interest rate announcement.  The RBA kept interest rates at their current historical lows but indicated they could raise rates in coming months.

Given the current elevated nature of the XJO rally, that was sufficient to produce a sell-off in the XJO.

Below is a daily chart of the XJO:


XJO starte is descent before mid-day - it probably sensed a negative tone to the RBA announcement.  When the announcement came out - the XJO tanked.

We've had a series of lack-lustre candles in recent days.  A down day would put out market into a serious decline.

Monday, April 4, 2022

Finspiration Australia. Major U.S. indices rise after Friday's big fall. 5/4/22.

Overnight.


Dow Jones +0.3%.  SP500 +0.81%.  Nasdaq +1.9%.  Small Caps -0.38%.  Banks -0.02%.

The Yield Curve remains inverted.  2Yr Treasuries at 2.42%.  10Yr Treasuries at 2.41%.

SP500.


Dip buyers came into the market and SP500 shows strong intra-day buying.  It has found support at multiple levels: 8-Day EMA, Tenkan Sen (Conversion Line) Supertrend (1.5/7) and top line of the "Cloud".

A strong up-day tomorrow will confirm the resumption of the bull rally.

Commodities.


Commodities Index +1.91%.  Energy +2.39%.  Base Metals -0.42%.  Gold +0.48%.

Iron Ore +1.3%.

U.S. Advances-Declines Cumulative.


A-D Line remains bullish, but momentum has slowed as indicated by the MACD Histogram which has flattened out.  That suggests we could be looking at another pull-back in the near future.

Overnight Oz Futures +0.6% but Oz big miners were down overnight, BHP -0.7% and RIO -1.57%.  If that flows through to Australia, it will put a damper on gains in the XJO.


Finspiration Australia. XJO up modestly. 4/4/20

XJO up today +0.27%.


 XJO is in a consolidation pattern at the top of its recent rally.  This is looking like topping action.

The market remains bullish - so any pull-back is likely to be bought.

Saturday, April 2, 2022

Finspiration Australia. Weekly Wrap, week ending 1/4/22.

          XJO up again this week.  

XJO Monthly Chart.


March was a good month for the XJO, up +6.39%.   The index had been in a down-trend since September, 2021 that has now switched to an up-trend with the Hull MA13 switching from blue to yellow and the monthly candle finishing well above the 8-Month EMA.  The Hull MA is confirming the trend change on the 8-Month EMA - that's usually a reliable signal.

Weekly Chart.


XJO was positive this week, +1.18%. That's the third week up in a row - which could be stretching the friendship a little too far.

The chart, however, is unequivocally bullish.  It has moved above the 8-Week EMA, Supertrend (1.5/7) has flipped to bullish and the Hull Moving Average has also flipped to bullish (yellow dashes)


Daily Chart.


This week, XJO moved above a key horizontal resistance level 4720.  On Thursday and Friday, it fell back a little to test that level.

CCI is beginning to show negative divergence, so a pull-back may be coming soon.  A drop back to test the 200DMA and then bounce would be very bullish.  

At this stage, XJO remains bullish.  If we get a pull-back be prepared to buy-the-dip.

Sector changes this week.


Eight sectors were up this week, three negative.

Materials (XMJ) dominated the Australian market this week,  Materials +3.65%.  XMJ hit an all-time high this week - that suggests we'll see more upside.  

Gold (XGD), BEAR (ETF inverse of XJO) and IAF (Multiple Bonds) all performed poorly in the past week.  These tend to be safe havens when the market tanks.


New Highs - New Lows Cumulative.

NH-NL Cumulative this week broke above its 10-Day Moving Average, although the upside break isn't particularly convincing.


Strengthening in the NH-NL Cum is confirmed by my weekly Strong-Weak Stocks Cumulative chart.  It has been above its 5-Week Moving Average for the second week in a row.  That's a bullish sign.


These are good guides for long-term investors.

Advances-Declines Cumulative.


A-D Cumulative has risen above both its 10-Day and 20-Day Moving Averages.  That's a bullish development.  That complements the view from the Weekly XJO chart - and confirms the bullish bias of our market.


Bonds versus Stocks.


At the end of the week, Stocks had a clear advantage over Bonds.  That's consistent with the strong rally we've had the past two weeks.   

This can act as a contrarian signal.  If stocks are acting too strongly compared to bonds, we may see some change in the relativities between stocks and bonds.  The ratio is now the highest it's been since November, 2021.  It can, of course, go higher, but the higher it goes brings it closer to a reversal.  The Ratio does appear to be faltering, so a pull-back in stocks might be in order.  That is consistent with the negative divergence in the CCI (noted above).

Stocks above key moving averages - last week and this week.

A look at the number of stocks in the ASX100 above key moving averages provides an idea of how bad/good things are.

1.  ASX100 stocks above 10-Day MA:  Last week 79%.  This week 62%.  

2.  ASX100 stocks above 50-Day MA: Last week 54%.  This week 70%.

3.  ASX100 stocks above the 200-Day MA: Last week 41%.  This week 50%.

This is the first time in many weeks that all three measures have been at or above 50%.  None is at an extreme level (above 80) so continuation of the up-trend seems likely.

The drop in the number of stocks above the 10-Day MA is consistent with the weakness we saw at the end of this week.

Conclusion.

We've had three weeks of strong gains.  The weekly and daily charts are unequivocally positive.  Of course, if it's that positive we're likely to see a change in sentiment.  That's already being signalled by contrarian indicators such as the CCI, Stocks/Bonds Ratio and short-term breadth measured by stocks above key moving averages.  Contrarian signals should be taken as warning signals, watch market action for confirmation one way or the other.

Any pull-back is likely to be bought as the XJO is now above the 200-Day MA.

Good luck and good investing.

Friday, April 1, 2022

Finspiration Australia. Yesterday, XJO flat, U.S. Indices up a little. 2/4/22

Yesterday in Australia.

XJO finished down just -0.08%


 Yesterday was a narrow range day, barely moving from the finish of the previous day.  

The up-trend is still intact,  Plenty of downside support remains.

Overnight.


Intra-day buying took the three major indices into positive territory.

Dow Jones +0.4%.  SP500 +0.34%.  Nasdaq +0.29%.  Small Caps +0.97%.  Banks remain under pressure, -1.26%.

SP500.


 Intra-day buying took the SP500 into positive territory and bounced off the first line of support.

This may be the end of the short-term pull-back.  We need to see confirmation of an upside day on Monday.

Commodities.


Commodities Index +0.65%.  Energy +1.43%.  Base Metals +0.97%.  Gold -0.64%

Energy and Base Metals are in consolidation patterns.  This could go either way, but more likely up than down.

Those overnight results look good for a mildly positive opening in Australia on Monday.

New York Advance-Decline Line.


The Advance-Decline Line for the New York Equities is in an up-trend.  That's positive for the near-term future of the U.S. market.

Finspiration Australia. 14/11/23. Tues. Morning Report.

Mixed Results in New York.  Energy up. NAB ex-dividend today. Dow Jones +0.16%.  SP500 -0.08%.  Nasdaq -0.11%.  Small Caps -0.07%.  Banks -0...