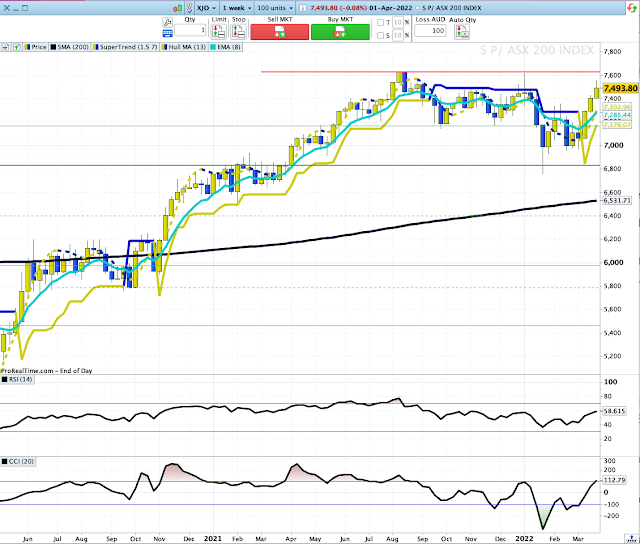
XJO up again this week.
XJO Monthly Chart.
Daily Chart.
This week, XJO moved above a key horizontal resistance level 4720. On Thursday and Friday, it fell back a little to test that level.
CCI is beginning to show negative divergence, so a pull-back may be coming soon. A drop back to test the 200DMA and then bounce would be very bullish.
At this stage, XJO remains bullish. If we get a pull-back be prepared to buy-the-dip.
Sector changes this week.
These are good guides for long-term investors.
Advances-Declines Cumulative.
A-D Cumulative has risen above both its 10-Day and 20-Day Moving Averages. That's a bullish development. That complements the view from the Weekly XJO chart - and confirms the bullish bias of our market.
Bonds versus Stocks.
Stocks above key moving averages - last week and this week.
A look at the number of stocks in the ASX100 above key moving averages provides an idea of how bad/good things are.
1. ASX100 stocks above 10-Day MA: Last week 79%. This week 62%.
2. ASX100 stocks above 50-Day MA: Last week 54%. This week 70%.
3. ASX100 stocks above the 200-Day MA: Last week 41%. This week 50%.
This is the first time in many weeks that all three measures have been at or above 50%. None is at an extreme level (above 80) so continuation of the up-trend seems likely.
The drop in the number of stocks above the 10-Day MA is consistent with the weakness we saw at the end of this week.
Conclusion.
We've had three weeks of strong gains. The weekly and daily charts are unequivocally positive. Of course, if it's that positive we're likely to see a change in sentiment. That's already being signalled by contrarian indicators such as the CCI, Stocks/Bonds Ratio and short-term breadth measured by stocks above key moving averages. Contrarian signals should be taken as warning signals, watch market action for confirmation one way or the other.
Any pull-back is likely to be bought as the XJO is now above the 200-Day MA.
Good luck and good investing.


No comments:
Post a Comment