XJO up today +0.27%.

XJO is in a consolidation pattern at the top of its recent rally. This is looking like topping action.
The market remains bullish - so any pull-back is likely to be bought.
XJO up today +0.27%.
The market remains bullish - so any pull-back is likely to be bought.
XJO up again this week.
XJO Monthly Chart.

Weekly Chart.

Daily Chart.

This week, XJO moved above a key horizontal resistance level 4720. On Thursday and Friday, it fell back a little to test that level.
CCI is beginning to show negative divergence, so a pull-back may be coming soon. A drop back to test the 200DMA and then bounce would be very bullish.
At this stage, XJO remains bullish. If we get a pull-back be prepared to buy-the-dip.
Sector changes this week.


These are good guides for long-term investors.
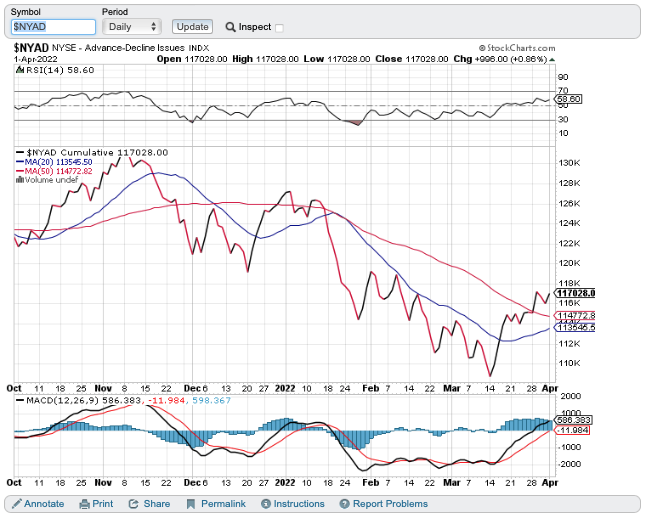
Advances-Declines Cumulative.

Bonds versus Stocks.

Stocks above key moving averages - last week and this week.
A look at the number of stocks in the ASX100 above key moving averages provides an idea of how bad/good things are.
1. ASX100 stocks above 10-Day MA: Last week 79%. This week 62%.
2. ASX100 stocks above 50-Day MA: Last week 54%. This week 70%.
3. ASX100 stocks above the 200-Day MA: Last week 41%. This week 50%.
This is the first time in many weeks that all three measures have been at or above 50%. None is at an extreme level (above 80) so continuation of the up-trend seems likely.
The drop in the number of stocks above the 10-Day MA is consistent with the weakness we saw at the end of this week.
Conclusion.
We've had three weeks of strong gains. The weekly and daily charts are unequivocally positive. Of course, if it's that positive we're likely to see a change in sentiment. That's already being signalled by contrarian indicators such as the CCI, Stocks/Bonds Ratio and short-term breadth measured by stocks above key moving averages. Contrarian signals should be taken as warning signals, watch market action for confirmation one way or the other.
Any pull-back is likely to be bought as the XJO is now above the 200-Day MA.
Good luck and good investing.
Yesterday in Australia.
XJO finished down just -0.08%

The up-trend is still intact, Plenty of downside support remains.
Overnight.

Dow Jones +0.4%. SP500 +0.34%. Nasdaq +0.29%. Small Caps +0.97%. Banks remain under pressure, -1.26%.
SP500.

This may be the end of the short-term pull-back. We need to see confirmation of an upside day on Monday.
Commodities.

Energy and Base Metals are in consolidation patterns. This could go either way, but more likely up than down.
Those overnight results look good for a mildly positive opening in Australia on Monday.
New York Advance-Decline Line.
Overnight.

SP500.

Commodities.

Iron Ore was flat, down just four cents to $150.84 tonne.
After an hour of trading, XJO has rebounded from early big falls. It is now down -0.09%. That's a promising start to the day.
XJO finished down today -0.2%, breaking a surge of seven up days. XJO was up early in the day, but an afternoon reversal cratered the index.

XJO has bad a great run recently so a pull-back is not to be unexpected. The negative divergence on the CCI has been signalling the possibility of a pull-back.
XJO has plenty of down-side support. So any pull-back is likely to be bought.
Nine sectors were down today. The stalwart in the market was Materials, up +1.5%.
Overnight.

European stocks also fell, with STOXX600 down -0.4%.
SP500.

Commodities.

Iron Ore +0.4%.
Those good Commodity and IO figures should give Ozzie resources a boost today.
Overnight Oz Futures are up a little, 10 points or +0.1%.
Overnight, BHP was up +3.1% in the U.S. after falling yesterday in Australia just a little -0.08%.
XJO up today +0.67%.

Today was the seventh day up in a row. RSI is now pressing on overbought. RSI now 69.83. Overbought is considered above 70.
CCI continues to show a negative divergence. It is often early, but rarely wrong.
This strong rally is close to an exhaustion point.
Mixed Results in New York. Energy up. NAB ex-dividend today. Dow Jones +0.16%. SP500 -0.08%. Nasdaq -0.11%. Small Caps -0.07%. Banks -0...


