Wednesday, December 29, 2021

 Thu. a.m. 30/12/21.  Dow up for sixth day.

Overnight:


Dow Jones +0.25%.  SP500 +0.14%.  Nasdaq -0.1%.  Small Caps +0.41%.  Banks -0.01%. 

SP500.


The double doji candle-sticks suggest that this is the end of this run-up.  The trend remains up, so, until we see definite signs of a pull-back stay with the trend.  Given seasonal tendencies, any dip is likely to be bought.

Commodities.


Commodities Index +0.48%.  Energy 0.46%.  Base Metals -0.5%.  Gold -0.03%.

Iron Ore +0.3%.

After 40 minutes of trading, XJO is flat, up just 0.06%.


 Wed. p.m. 29/12/21.  XJO up for fifth day.


XJO had a very strong day today, up +1.21%.

That represents a break-out from th recent trading range.  Expect more upside.

Given the strength of today's action, we might see the XJO settle back for a day or two.

VIX is suggesting that as it rose today from from 10.8 to 11.26.  VIX tends to trade inversely to the XJO, so when it rises as the XJO rises, that's a warning signal.

Tuesday, December 28, 2021

 Wed. a.m. 29/12/21.  Dow up for fifth day.

Overnight.


Dow Jones +0.26%.  SP500 -0.1%.  Nasdaq -0.56%.  Small Caps -0.3%.  Banks -0.03%.

SP500.


SP500 took a rest day after four days to the upside.  We may see some more consolidation.  The trend remains up - stay with the trend.

Commodities.


Commodities Index -0.19%.  Energy +0.46%.  Base Metals -0.36%.  Gold -0.43%.

Iron Ore market was closed.

After 45 minutes of trading, the ASX200 is up about 1%.

Monday, December 27, 2021

    Weekly Wrap, Week ended 24/12/21.  XJO rises from crucial level

XJO Monthly Chart:


XJO peaked in August, 2021.  It has since fallen September-November. So far in December, XJO has risen strongly above the crucial 8-month Exponential Moving Average.  

XJO Weekly Chart:


The weekly XJO Chart up strongly this week, +1.59%.  

The chart shows a wide trading range which switched the weekly trend from up to sideways.  A break above 7479 should be bullish.  A break below the 50-Week Moving Average (blue, curving line) would be bearish.

Currently, this week's candle is knocking on the top of the trading range. 

Daily XJO chart:


This week, XJO had four up days, which took the chart above the Ichimoku Cloud.  Chikou Span is also above the Ichimoku Cloud and the candlestick chart.  That puts the XJO into a bullish trend using the Ichimoku system.  Stay with the trend.

One Week Sector Changes:


The previous week's big losers were this week's big winners, Health (XHJ) +6.28% and Information Technology (XIJ) +3.51%.  Utilities (XUJ) +2.61% continues to perform well.  Only one stock was clearly down, Industrials (XNJ) -0.58%.  Two sectors were flat, Property (XPJ) -0.06% and Energy (XEJ -0.01%.  


NewHighs-NewLows Cumulative.

For long-term investors, this is one of the most important charts to watch.


The Cum NH-NL is now sitting above its 10-Day Moving Average after a small rise this week.  


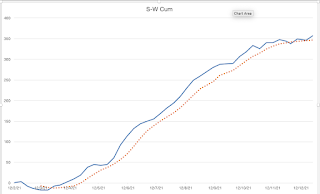
The Strong-Weak Stocks Chart rose this week, providing a confirmation of the Cum NH-NL.  


Stocks in the ASX100 above the 200-Day MA.


% of stocks in the ASX100 above the 200-Day MA rose this week from 53% to 73%.  That keeps it well above the bearish level of 50%.  More importantly, it has now broken the sequence of lower highs and lower lows (definition of a down-trend).  


Cumulative Advances-Declines was up marginally this week, but remains in a bearish trend below its 10-Day Moving Average.


Conclusion: The XJO still hasn't broken out of its sideways range, but the daily chart is bullish using the Ichimoku system.  We're now into the Santa Rally space.  So we should continue to see more upside in the short-term trend.  

America was strong last night (Monday night), so, barring black swans, we should have another solid day when we reopen on Wednesday, after two days of public holidays.

Now - back to the cricket at the MCG.


 Tue. a.m. 28/12/21.  SP500 jumps to new record high.

Overnight in America.


Dow Jones +0.98%.  SP500 +1.38%.  Nasdaq +1.39%.  Small Caps +1.44%.  Banks +1.15%.

SP500.


The Santa Rally has now extended to four days in a row, with a new all-time closing high for the second day in a row.

The trend on all time frames remains bullish.  Stay with the trend.

Commodities.


Commodities Index +1.26%.  Energy +1.89%.  Base Metals +0.23%.  Gold +0.24%.

The Australian stock market is closed today for holidays.  

Thursday, December 23, 2021

 Fri. a.m. 24/12/21.  SP500 closes at new record high.

Overnight:


Dow Jones +0.55%.  SP500 +0.62%.  Nasdaq +0.85%.  Small Caps +0.61%.  Banks +0.58%.

SP500.


SP500 finished with a record closing high, but not an all time intra-day high.  So it is lying within a fuzzy horizontal resistance area.  Everything else is bullish.  Stay with the trend.

Commodities.

Commodities Index +0.54%.  Energy +0.96%.  Base Metals +0.27%.  Gold +0.23%.

Iron Ore +0.9%.

After 30 minutes of trading, XJO is up 0.6%.


 Thu. p.m. 23/12/21.  XJO rose modestly today.

XJO was up +0.31%, but remains doggedly within its trading range of the past four months.

Monday's bounce off the 200-Day Moving Average opens up the possibility that XJO is in a rising right-angle triangle.  A break through horizontal resistance would be bullish.

Currently, stocks are preferred to bonds.  So we do have a bias to risk-on for stocks according to this ratio.


Tonight is the last trading session for the U.S.  Tomorrow in Australia we have a shortened trading session.  It is usually accompanied by low volume - which opens up the possibility of sudden movements in the index one way or the other.  Tomorrow could be interesting.

Finspiration Australia. 14/11/23. Tues. Morning Report.

Mixed Results in New York.  Energy up. NAB ex-dividend today. Dow Jones +0.16%.  SP500 -0.08%.  Nasdaq -0.11%.  Small Caps -0.07%.  Banks -0...