Weekly Wrap, Week ended 24/12/21. XJO rises from crucial level
XJO Monthly Chart:

XJO peaked in August, 2021. It has since fallen September-November. So far in December, XJO has risen strongly above the crucial 8-month Exponential Moving Average.
XJO Weekly Chart:

The weekly XJO Chart up strongly this week, +1.59%.
The chart shows a wide trading range which switched the weekly trend from up to sideways. A break above 7479 should be bullish. A break below the 50-Week Moving Average (blue, curving line) would be bearish.
Currently, this week's candle is knocking on the top of the trading range.
Daily XJO chart:

This week, XJO had four up days, which took the chart above the Ichimoku Cloud. Chikou Span is also above the Ichimoku Cloud and the candlestick chart. That puts the XJO into a bullish trend using the Ichimoku system. Stay with the trend.
One Week Sector Changes:

The previous week's big losers were this week's big winners, Health (XHJ) +6.28% and Information Technology (XIJ) +3.51%. Utilities (XUJ) +2.61% continues to perform well. Only one stock was clearly down, Industrials (XNJ) -0.58%. Two sectors were flat, Property (XPJ) -0.06% and Energy (XEJ -0.01%.
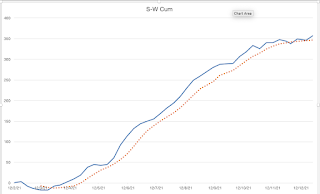
NewHighs-NewLows Cumulative.
For long-term investors, this is one of the most important charts to watch.

Stocks in the ASX100 above the 200-Day MA.

Cumulative Advances-Declines was up marginally this week, but remains in a bearish trend below its 10-Day Moving Average.
Conclusion: The XJO still hasn't broken out of its sideways range, but the daily chart is bullish using the Ichimoku system. We're now into the Santa Rally space. So we should continue to see more upside in the short-term trend.
America was strong last night (Monday night), so, barring black swans, we should have another solid day when we reopen on Wednesday, after two days of public holidays.
Now - back to the cricket at the MCG.


No comments:
Post a Comment