September was crook. XJO down -3.5% for the month. September is usually down, so nothing unusual there. Only - it was unusual, unusually bad. September averages about -1% down, so it was much worse than usual.
What about October? October gets a bad rap for big, big declines. Nobody who lived through it can forget 19 October, 1987 when the Dow Jones dropped 22.6%, in one day. But - that's the exception to the rule, O is usually up about +1%. So we've got September behind us. we can look forward to better times.
XJO Monthly Chart

I've been banging on about this for a long time, the monthly chart of XJO has been range bound since Nov. 2022 - no trend. That's coming up towards a year. Rarely do we see such a long-term range bound market.
The range is conveniently marked by two Supertrend Lines. Supertrend 2/11 1s the upper limit and it sits at 7554. The lower limit is Supertrend 1/10 which sits at 6922.
History shows we are coming into the best six months of the year, so this current long-term sideways consolidation is likely to break to the upside.
This week, the RBA meets for its Interest Rate decision. That could be market moving. I doubt it will be enough to result in a break in the market through the restraining Supertrend,
XJO Weekly Chart.

This week, the ASX fell modestly, down -0.29%. A welcome reprieve from the volatility of the previous week.
Horizontal support held which is a big positive.
XJO Daily Chart.

Horizontal support is shown by the dotted line from early July. That held this week after being tested. Friday saw a move to the upside which is a positive.
Positive divergence onMACD Histogram suggests the next major move will be to the upside.
Sector Performances this week.

Defensives did realtively well. Health +0.15%, Staples +0.22%. Telecommunications -0.12%.
The worst performer was IT -1.45%. Over the long term, IT tends to be a strong performer but jerks around a lot. If we're looking at better times ahead, I'd expect IT to out-perform.
100 Leader Stocks above their 200-Day, 50-Day and 10-Day Moving Averages.
- Above their 200-DMA: last week 37%, this week 36%.
- Above their 50-DMA: last week 25%, this week 27%
- Above their 10-DMA: last week 24%, this week 30%.
The Stocks above 50DMA are at 27% - we don't often see figures that low without a rebound coming soon.
The last time was in late June and early July.
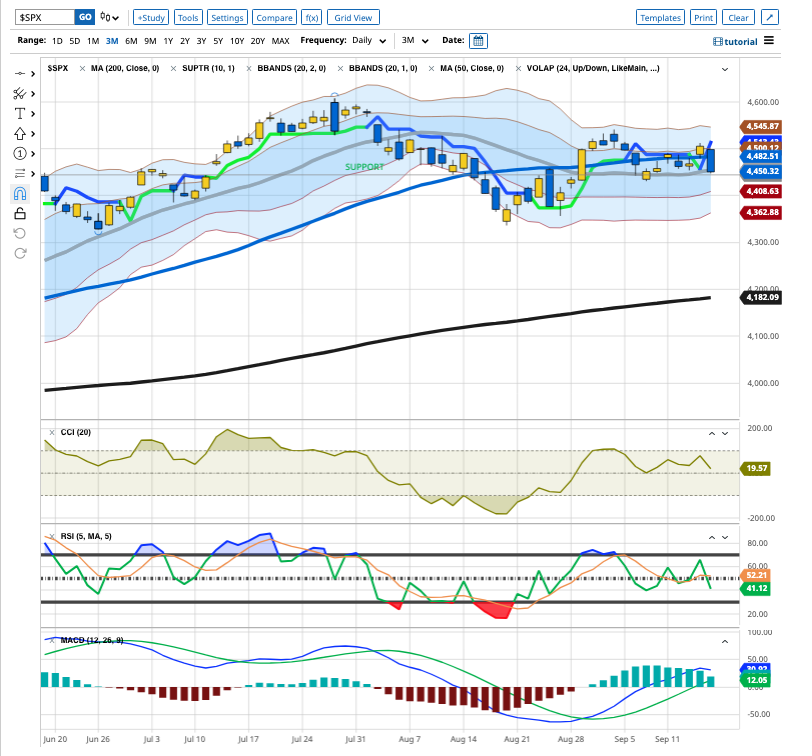
SP500 - American Market.
Conclusion.
September was, predictably, poor - but worse than usual.
We're coming into October, usually a better month than September. There are plenty of signs to suggest that the worst may now be past and we could be looking at some upside from here.
Good Luck
Be aware that there are no guarantees on the stock market. The old adage must be remembered: past performance is no guarantee of future performance.
If the market breaks decisively below support - then all bets are off.