23/10/22. Weekly Wrap - Week ended 21/10/22.
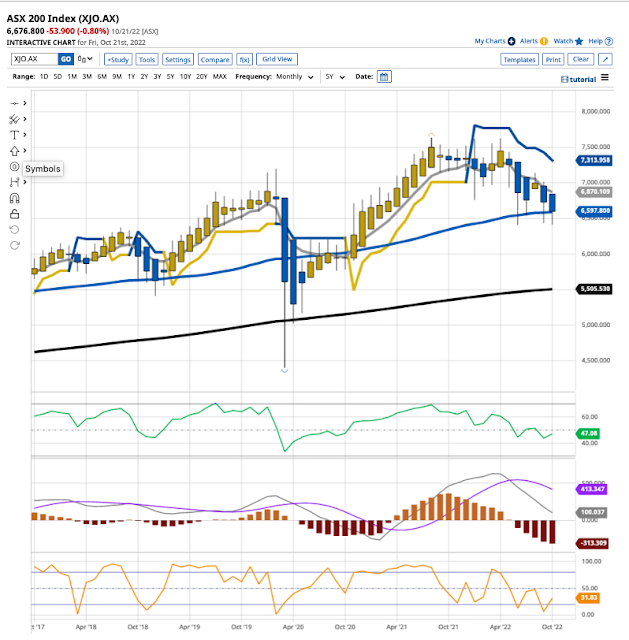
XJO Monthly Chart.
XJO continues to hold at support of the 50-Month Moving Average.It remains in a down-trend, below the 8-Month Exponential Moving Average and below the Supertrend Line (7.1.5). This down-trend started a year ago.
The average bear market is 289 days - or about nine months. We're beyond that now - so we could see a rebound soon. But - you know what they say about averages?
Plans based on the assumption that average conditions will occur are wrong on average. A humorous example involves the statistician who drowned while fording a river that was, on average, only three feet deep.
Only take action on this chart at the end of the month - one week to go.
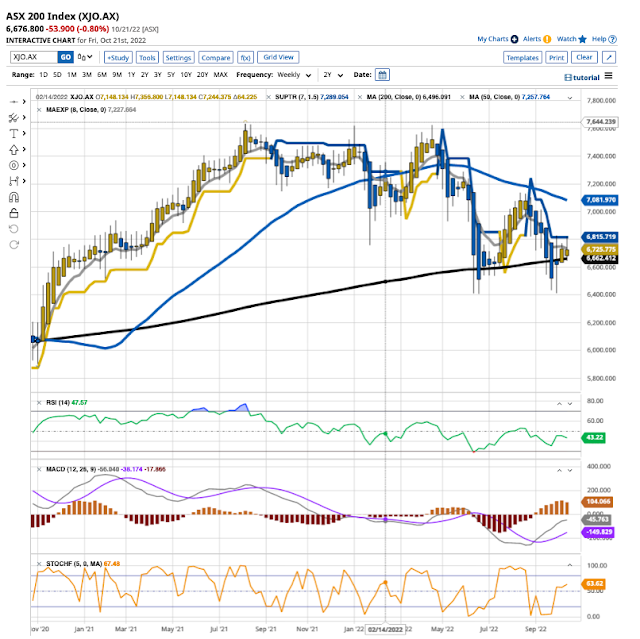
XJO Weekly Chart.
In this chart we can see the importance of the 200-Week Moving Average. It's been support since mid-June this year. There's been a nice tradable rally since then, but XJO has been revisiting that level for the past 5 weeks without breaking decisively below.
Resistance is being provided by the weekly Supertrend Line (7,1.5). A break above that would be bullish.
XJO Daily Chart.
XJO in the short-term remains in a sideways consolidation pattern.It remains in a down-trend (lower highs and lower lows).
If it can get above the 50-Day MA (likely next week) we could see a test of the 200-Day MA.
For now, monthly, weekly, and daily charts are in sync - bearish.
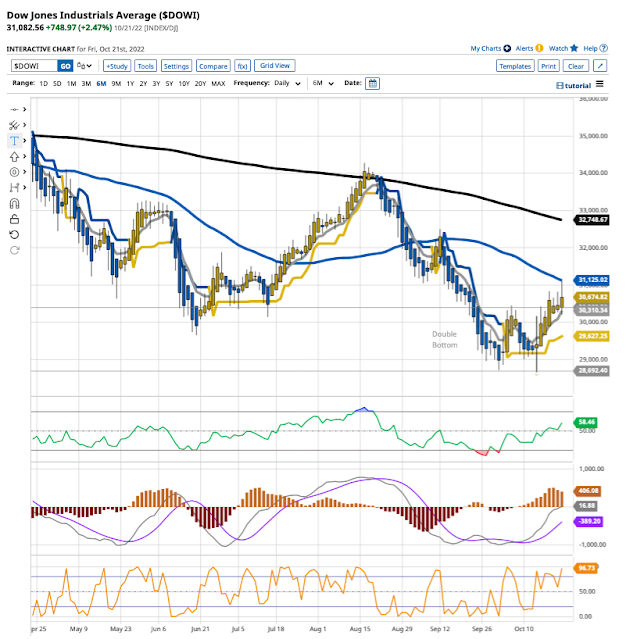
Dow Jones Industrial Average Daily.
Dow Jones has formed a double bottom - usually a reliable precursor to a sustainable rally.
The chart is now finding resistance at the 50-Day MA. A break above that would be bullish and should see a test of the 200-Day MA.
On Friday night, Dow Jones was up +2.47% - and the ASX should follow suit - but not of the same magnitude.
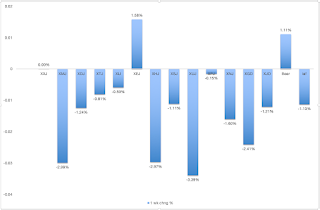
ASX Sector Results for this week.
It was a poor week for the XJO which was down -1.21%. Only one sector was up - Energy +1.58%. Worst were Utilities -3.39%, Materials -2.99% and Health -2.97%. Financials was flat 0.00%.
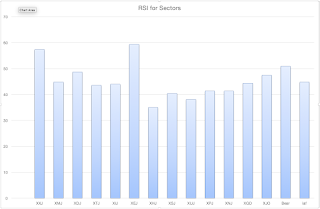
Relative Strength of Sectors.
RSI (Relative Strength Index) is calculated using the default setting of 14 days - almost three weeks of trading. It provides a more reliable guide to changes in sectors than the one-week results which can jerk around quite a lot and, thus, RSI is probably a more reliable guide to recent strength in the sectors. (Click here for a description of RSI.)
Two sectors out of eleven are above 50. The previous week we saw four sectors above 50 - so breadth is wearing. Leadership is shared by Energy and Financials - the only two sectors above 50.
NewHighs-NewLows Cumulative.
This is a metric for the long-term investor. While NH-NL Cumulative remains below its 10-Day Moving Average, it is best for long term investors to remain cautious and defensive regarding the market.




No comments:
Post a Comment