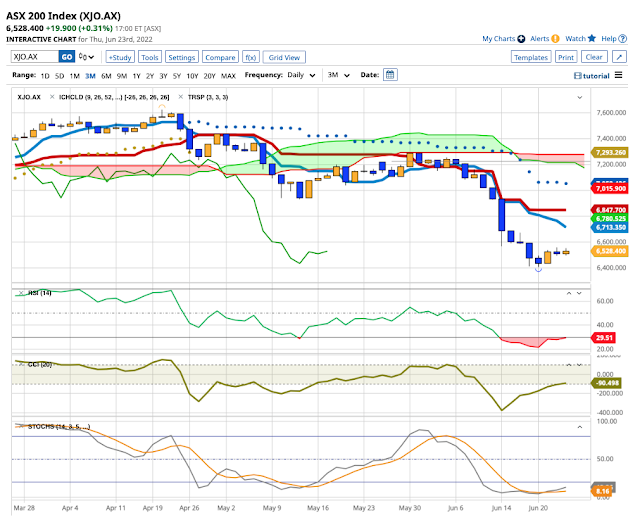
23/6/22. XJO up a little today +0.31%.
Today was another narrow range day much like Wednesday, except today finished on the plus side while Tuesday was down a bit.
Monday's action still looks bullish.
Indicators are so low that more upside seems likely, especially as the CCI has a good positive divergence.
Breadth remains poor - which is a negative. Advances/Declines to day were 551/941. Here's the Advances-Declines Chart:
This A-D Chart remains bearish.
Taking a contrarian view, the Stocks/Bonds chart is close to a two-year low. Extremely low levels usually precede a reversion to the mean. That suggests we could see a move up in Stocks relative to Bonds.
We're coming in to the end of the Financial Year in Australia. We could see some funny business as Fund Managers square up their books to make their performance look a bit better. This half year has been disastrous - so we could see some strange activity in the next week.


No comments:
Post a Comment