Thursday, June 30, 2022

Finspiration Australia. Stock Analysis for Australian and International Stock Markets.

1/7/22.  Overnight - U.S. equities finish lower.


 Dow Jones -0.82%.  SP500 -0.88%.  Nasdaq -1.33%.  Small Caps -0.39%.  Banks -1.64%.

SP500.


Last night, SPX fell below support then recovered to remain between support and resistance.  That provides some optimism that the next move will be to the upside.  Wait.

For the first half of 2022, SPX is down almost -20%.

Commodities.


Commodities Index -3.09%.  Energy -3.25%.  Base Metals -3.53%.  Agriculture -1.55%.  Gold -0.61%.

Iron Ore -0.1%.  Thermal Coal +1.6%.

Well - if all of the above doesn't say we'll be down today, I don't know what would.  But, for some reason I can't see, Overnight Oz Futures are up +0.2%.  Maybe it's because bond yields fell overnight (bond prices higher), which may have a positive effect on stocks today.  We shall see.

Finspiration Australia. Chart Analysis for Australian and International Stock Markets.

 30/6/22.  Financial Year finishes down almost -2%.


For first-half of 2022, XJO was down -11.8%.


Here's to a better second-half of 2022.

Wednesday, June 29, 2022

Finspiration Australia. Chart Analysis for Australian and International Stock Markets

30/6/22.  Overnight.  Mixed results in the U.S.


 Dow Jones +0.27%.  SP500 -0.07%.  Nasdaq -0.03%.  Small Caps -1%.  Banks -1.05%.

SP500.

SP500 had a narrow range day and is stuck between support and resistance.  Wait.

Commodities.

Commodities Index -1.72%.  Energy -2.56%.  Base Metals -0.25%.  Agriculture +0.63%.  Gold -0.08%.

Iron Ore -0.1%.  Thermal Coal -3.4%.

Overnight Oz Futures were flat 0.0%.

It looks like a flat opening on the XJO.

In economic news, U.S. GDP contracted at a -1.6% year-on-year pace in the first quarter of 2022.  Jerome Powell, Chair of U.S. Federal Reserve Bank, reiterated its stance that the Fed's job is to prevent higher inflation, i.e. raise interest rates.  It seems to me that the U.S. is headed for recession defined as two quarters of negative growth.


Finspiration Australia. Chart Analysis of Australian and International Stock Markets.

 XJO followed U.S. down today -1.1%.


Eight out of eleven sectors were down.  Interestingly, one of the sectors on the positive side was Financials (XXJ +0.3%).  The worst sector was the interest rate sensitive Property (XPJ-4%)

I'm still expecting more downside.


Tuesday, June 28, 2022

Finspiration Australia. Chart Analysis for Australian and International Stock Markets.

 29/6/22.  Overnight.  Big sell-off in U.S. tech stocks.


Dow Jones -1.56%/.  SP500 -2.01%.  Nasdaq -2.98%.  Small Caps -1.52%.  Banks -0.48%.

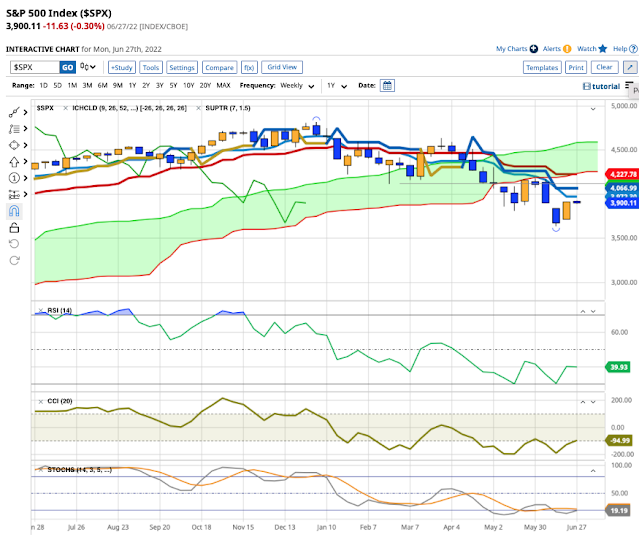
SP500.

The three-day candle-stick pattern (up candle, doji, down candle) is a classic reversal pattern.

It has happened at a strong resistance level, the Kijun Sen (Base Line).  That also coincides with the 20-Day MA (see thumb-nail chart above).

A reversal pattern occurring at strong resistance is usually reliable.  Look for a test of the recent low.

Commodities.


Commodities Index +1.19%.  Energy +1.13%.  Base Metals flat 0.00%.  Agriculture +0.44%.  Gold -0.16%.

Iron Ore +0.5%.  Thermal Coal +0.3%.

After 15 minutes of trading, XJO down -0.9%.  Those good commodity prices might soften the effect on miners and energy stocks.

Finspiration Australia. Chart Analysis of Australian and International Stock Markets.

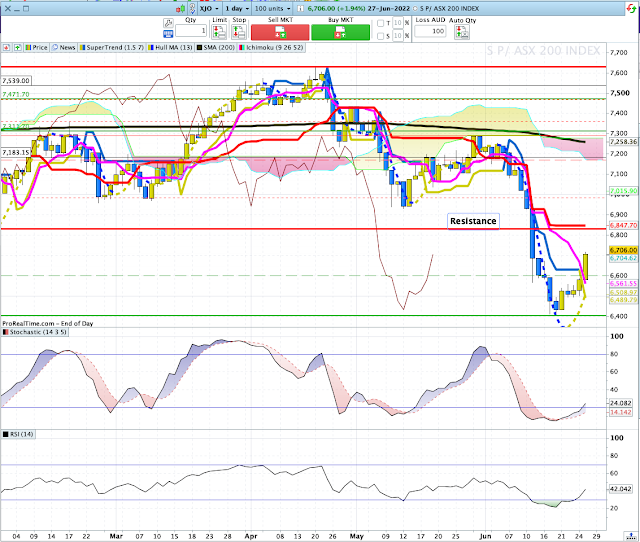
 XJO up again today +0.86%.

XJO is in a short-term counter-trend rally.

Next major resistance is the Kijun Sen (Base Line) at 6848.  XJO finished today at 6706.  We have some more upside in this rally.

Energy +3.62% and Materials +3% underpinned today's rally.

We've had a couple of strong days in a row.  It wouldn't surprise if we see a settling back tomorrow.  It will depend largely on the Resource Sectors.


Monday, June 27, 2022

Finspiration Australia. Chart Analysis for Australian and International Stock Markets.

 28/6/22.  U.S. equities eased overnight.


Dow Jones -0.2%.  SP500 -0.3%.  Nasdaq -0.72%.  Small Caps -0.79%.  Banks -0.73%.

SP500.


A narrow range day after Friday's expansion day.  Plenty of resistance remains overhead.  Wait.

Commodities.

Commodities Index -0.22%.  Energy +0.33%.  Base Metals +0.4%.  Agriculture -1.21%.  Gold -0.11%.

Iron Ore +0.9%.  Thermal Coal +1.4%.

Overnight Oz Futures flat 0.0%.

Finspiration Australia. Chart Analysis for Australian and International Stock Markets.

 27/6/22.  XJO up strongly, +1.94%.


Price action today was positive with the XJO finishing above the Tenkan Sen (Conversion Line) and Supertrend (1.5/7) switching from blue (bearish) to yellow (bullish).

Horizontal Resistance now stands at 6848 which coincides with the Kijun Sen (Base Line).

Stochastic has finished above 20 which is bullish.

Breadth today was good, although not as good as Friday.  Advances-Declines today 903-636 = Net 267.

Friday Advances-Declines 988-476 = Net 512.

All eleven sectors were up today with the best performer being Financials (XXJ +2.64%). XXJ has been under pressure lately, so that's a welcome move to the upside.


Saturday, June 25, 2022

Finspiration Australia. Chart Analysis for Australian and International Stock Markets

       Weekly Wrap - Week ending 24 June, 2022.

XJO Monthly Chart.


The market has four trading days left in June.  The chart is bearish.

The monthly chart has broken down from its previous range 6930-7539, and finished the week at 6579.    

Both Supertrend Lines have turned blue (bearish).  All indicators are on the bearish side.

Weekly Chart.


XJO had a positive week, up +1.6%.  The chart, however remains bearish.

The rise this week took the Index back up and is testing the 200-Week Moving Average.

RSI14 is oversold at 32.85 - but it has climbed from below 30 to above 30 - providing some hope of further upside.

Two Supertrend lines, 8-Week MA and Hull MA13 are all bearish.

Monthly and Weekly Charts are in sync - bearish.

Daily Chart.


XJO is in a short-term counter-trend rally has indicated by Hull MA13 switching from blue (bearish) to yellow (bullish).  

Both Supertrend Lines are blue and heading sideways indicating a non-trending market.  Chart remains below the 8-DEMA.  8-DEMA is a short-term trigger line.  If XJO crosses above that (likely) we should see some more upside.  

RSI (14) is at 33.38 - oversold but rising.  I'd like to see that back above 50 before thinking of this as more than a short-term counter trend rally.

The medium and long-term trend remains bearish.

All three time frames are in sync - bearish.  Only take sell signals.  If there is a rebound, look to sell the rally.

SP500.


On Friday, SP500 had a big upside move, +3.06%.  That move switched all the short-term chart indicators from bullish (two Supertrend Lines and 8-DEMA).  Stochastic has pulled up above its 20 line.

Plenty of dynamic resistance remains overhead - 20DMA, 50DMA, 200DMA.

We may see more upside but the likelihood of a sustained bullish trend is low.

Sector Changes - past week.


It doesn't take a genius to see that we've had sector rotation this week, out of Resources (Materials and Energy) and into just about everything else.

The worst two sectors were Energy (XEJ -4.55%) and Materials (XMJ -4.88%.  

The best two sectors were interest-rate sensitive sectors, Information Technology (+8.09%) and Property (XPJ +7.33%).

Composite Government Bonds were up.  IAF +2.21%.  That suggests that big investors now think that the worst of the interest rate rises are built into the market.  Central Banks tend to lag behind the Bond market.  While Central Banks (including the RBA) are hell bent to raise interest rates to tramp down on inflation, they might just be a bit late to the party.  It may be too early to say this is now a trend, it is beginning to look that way.

Composite Bonds - IAF.


IAF (Australian Composite Bonds) had a sharp lift this week, up +2.21%.  There is a sense of panic in this chart not seen in previous counter-trend rallies with big gaps up between daily candles.  That is also shown in the Price Rate of Change Oscillator in the bottom panel.  The ROC has been particularly sharp to the upside, not seen in previous counter-trend rallies.  Something has changed in the psychology of Bond Traders this week.  This could be the harbinger of better things to come in Bonds and Stocks.  Too early to say just yet - but it is promising.

New Highs - New Lows Cumulative.

This is one of the important breadth indicators.  Unless breadth is solidly positive, the market is always under threat.

NH-NL Cumulative continues to fall and is now well under its 10-Day Moving Average, that's a big red danger sign for long-term investors.  


ASX Advance-Decline Line.

This is another important indicator of breadth.


ASX Advance-Decline Line is also bearish, and in sync with NH-NL Cum.


% of Stocks above key moving averages.

1.  % of stocks above 10-Day Moving Average: Last Week 5%, This Week 50%.
2.  % of stocks above 50-Day Moving Average, Last Week 3%, This Week 19%.
3.  % of stocks above 200-Day Moving Average, Last Week 21%, This Week 19%


This week's bounce in the XJO is reflected in the above numbers with the shortest term metric (stocks above 10-DMA) moving from 5% to 50%.

The other two longer-term metrics remain in bearish territory - both at 19%.

I'd like to see all of these above 50% to feel comfortable about the longer term fortunes of the market.

Conclusion.

1.  Monthly, Weekly and Daily Charts are all in sync - bearish.   Any rebound should be a signal to sell into the rally.  The XJO is currently in a short-term counter-trend rally.

2.  Breadth remains poor.  In the previous week, breadth figures were so bad contrarians took that as a chance to go long.  How much longer it will last - we'll have to wait and see.

3.  Bonds have spiked my interest this week.  The sharp up-turn in Bonds suggests a sense of panic amongst Bond traders.  Central Banks tend to lag the Bond market.  Further rises in bonds will suggest that Central Banks will renege on their affirmations of many more interest rate rises.  Too early to say, but worth watching.

3.  We need to see a move up above 20 on the Stochastic Daily chart for short-term traders to go long.      

Friday, June 24, 2022

Finspiration Australia. Chart Analysis for Australian and International Stock Markets.

 Yesterday in Australia.

After a weak start, XJO climbed higher to finish up +0.77%.


The chart show a short-term buy signal on the Hull MA13.  

RSI(14) is back above the 30 level which is another short-term buy signal.

Yesterday saw the best breadth figures for the ASX since early March.  Advances 988, Declines 476.  Net A-D = 512.  9/3/22 saw a Net A-D of 523.  That kicked off a rally which saw the XJO rise by 9% finishing on 21/4/22.  I'm not suggesting that we will see something similar this time, but it is promising.

Yesterday's move brings the XJO up to the first line of horizontal resistance and the 8-Day EMA.  Given events overseas last night, those two resistance levels will probably be overcome taking the XJO up to the Tenkan Sen (Conversion Line) of the Ichimoku system.

XJO is in a counter-trend rally - until proven otherwise.  Until the chart gets back above the Kumo cloud, rallies will probably be sold into at key resistance levels.

Overnight in the U.S.


Dow Jones +2.68%.  SP500 +3.06%.  Nasdaq +3.34%.  Small Caps +3.1%.  Banks +4.44%.

SP500.

SP500 has given short-term buy signals on the Hull MA13 and 8-DEMA.

Wide positive divergence on Money Flow Index was a leading indicator for the current move to the upside.

Last night's big move brings the SP500 up to a horizontal resistance level and resistance of the Kijun Sen (Base Line) of the Ichimoku system.  We might see some consolidation here.

Commodities.

Results in Commodities were mixed.

Commodities Index +0.95%.  Energy +1.45%.  Base Metals continued their long fall -1.71%.Agriculture +0.34%.  Gold flat -0.1%.

Monday should be good.  XJO++.


Thursday, June 23, 2022

Finspiration Australia. Chart Analysis for Australian and International Stock Markets

 24/6/22.  U.S. Indices finish higher pushed up in afternoon rally.


Dow Jones +0.64%.  SP500 +0.95%.  Nasdaq +1.62%.  Small Caps +0.84%.  Banks -1.35%.

Notice how the Banks fell while Nasdaq rose, that suggests that Bond yields fell (Bonds higher).  10 Year T-Note fell to 3.002%.

SP500.


SP500 could be forming a small H/n/S pattern with Stochastic breaking above 20 - that suggests we will see higher prices in the near future.  But SP500 is already running into its first level of resistance.  On Ichimoku that's the Tenkan Sen (Conversion Line) and above that is the Kijun Sen (Base Line.  Kijun Sen coincides, more or less, with the 20-Day MA.  That could be the stumbling block for the SP500.

Conditions remain bearish while the SP500 remains below the Kumo Cloud.  Don't expect too much from any rally.

Commodities.


Commodities Index -2.24%.  Energy -1.89%.  Base Metals -2.57%.  Agriculture -3%.  Gold -0.61%.

Iron Ore +1.8%.  Thermal Coal +1.4%.

Overnight Oz Futures -0.2%.  ASX will probably open flat today.

Finspiration Australia. Chart Analysis for Australian and International Stock Markets.

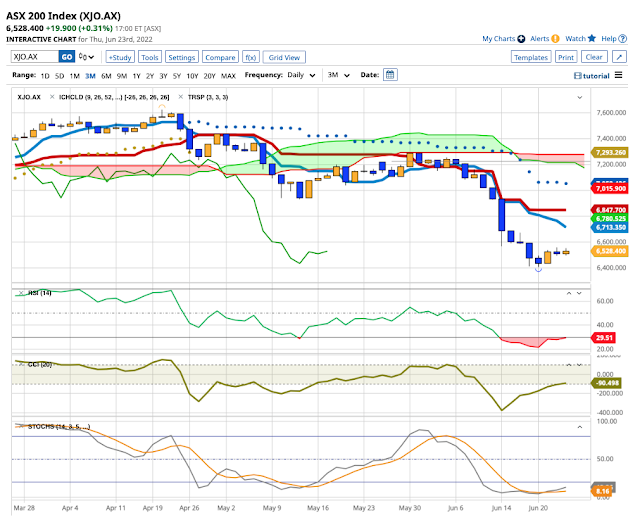
 23/6/22.  XJO up a little today +0.31%.


Today was another narrow range day much like Wednesday, except today finished on the plus side while Tuesday was down a bit.

Monday's action still looks bullish.

Indicators are so low that more upside seems likely, especially as the CCI has a good positive divergence.

Breadth remains poor - which is a negative.  Advances/Declines to day were 551/941.  Here's the Advances-Declines Chart:


This A-D Chart remains bearish.

Taking a contrarian view, the Stocks/Bonds chart is close to a two-year low.  Extremely low levels usually precede a reversion to the mean.  That suggests we could see a move up in Stocks relative to Bonds.


We're coming in to the end of the Financial Year in Australia.  We could see some funny business as Fund Managers square up their books to make their performance look a bit better.  This half year has been disastrous - so we could see some strange activity in the next week.

Wednesday, June 22, 2022

Finspiration Australia. Chart Analysis for Australian and International Stock Markets.

Overnight.

Major U.S. indices were flat overnight.


 Dow Jones -0.15%.  SP500 -0.13%.  Nasdaq -0.15%.  Small Caps -0.26%.  Banks -0.32%

SP500.


After Tuesday's big up move, Wednesday looks like a pause before the next move to the upside.

A break of Stochastic above 20 would be a short-term buy signal.

Commodities.


Commodities Index -1.78%.  Energy -2.03%.  Base Metals -0.99%.  Agriculture -1.21%.  Gold +0.4%

Iron Ore -1.5%.  Thermal Coal +0.5%.

Overnight Oz Futures +0.5%.

We might pull back some of yesterday's losses which now look like a move to pre-empt the overnight U.S. action.

Finspiration Australia. Chart Analysis of Australian and International Stock Markets.

22/6/22.   After a promising start today, XJO finished down today -0.23%.

XJP remains mired at the low end of its down-trend.  It remains very oversold so some upside seems likely.

We're in a bear market, so any upside is likely to be limited.

Five sectors were up today, but most were defensives.

Energy (XEJ) was up +1.52% and that dragged up Utilities (XUJ) +2.05%.  There were other factors at play in the increase in Utilities - the uncertainty about power supply seems to be stabilising.

Consumer Staples (XSJ) was up +0.53%.  Telecommunications (XTJ) up +0.19%.  Health (XHJ) up +0.22%.

The all important Financials (XXJ) down -0.39% and Materials (XMJ) down -0.19%.

In America, Dow futures are off 400 points or -1.58%.  That's not looking good for the overnight market or the Oz market tomorrow.

Tuesday, June 21, 2022

Finspiration Australia. Chart Analysis for Australian and International Stock Markets.

 22/6/22 Overnight.


Dow Jones +2.15%.  SP500 +2.45%.  Nasdaq +2.51%.  Small Caps +1.47%.  Banks +1.94%.

SP500.

This looks like a short-term bottom in the market.

Stiff resistance exists at around 3900.  SP500 finished at 3765.  Last night's rise was about 90 points.  So the Index might have another couple of days to the upside.

Commodities.


Commodities Index -0.24%.  Energy +0.47%.  Base Metals +1.15%.  Agriculture -1.1%.  Gold -0.37%.

Iron Ore -1.9%.

Overnight Oz Futures +0.7%.  Today ASX should build on yesterday's good gains.

Finspiration Australia. Chart Analysis of Australian and International Stock Markets

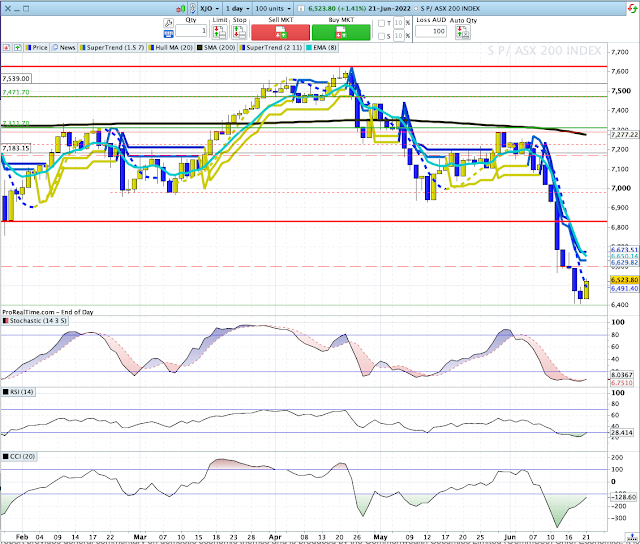
 XJO up strongly today +1.41%

The XJO shows a bullish engulfing candle.  That's usually a reliable signal.

The XJO is probably in a short-term upside move, a counter-trend rally.

The Index was very oversold (below 30) and the CCI shows a positive divergence.

So we can expect a few days to the upside.

Today eight sectors were up and three down.  That's a good breadth spread.

Financials (XXJ +2.65%) was one of the better results in the sectors.


That's a great bullish candle on the XXJ today - but it still has a lot of work to do to prove its bullish credentials.

Monday, June 20, 2022

Finspiration Australia. Chart Analysis of Australian and International Stock Markets

 Overnight.

NYSE closed overnight.

In Europe stocks rose strongly with EuroStoxx600 up +1%.  German DAX +1.06%.  Bank stocks up about +3%.  

DAX remains in non-trending mode with both Span A and Span B of the Kumo Cloud parallel to each other.  

Commodities.

Brent Crude Oil +0.9%.  Copper -0.3%.  Iron Ore -2.6%.  

In the U.K. BHP fell -1.6% and Rio -1%.  Those figures aren't too bad as in Australia yesterday BHP fell -5.3% and Rio -5.06%.

Overnight Oz Futures are up +47 points or +0.7%.

Yesterday in Australia, XJO down -0.64%, so our market on present indications should gain back most of yesterday's losses.


Finspiration Australia. Chart Analysis for Australian and International Stock Markets

 XJO fell for the seventh day in a row, down -0.64%.


The Index is very oversold with an RSI(14) at 21.6.  We rarely see figures that low on the XJO.

Seven Sectors were up and Four Sectors were down.  We have an unbalanced market which is good news for those in the bullish camp.

The worst performers today were Energy (XEJ -5.2%) and Materials (XMJ -4.6%).  

Best best performers today were Property (XPJ +3.6%), Consumer Discretionary (XDJ +2.8%) and Health (XHJ +2.4%). Financials (XXJ +0.6%) had a reasonably good lift today.

Volume fell to a three week low which might suggest that bears are losing interest in driving the market lower.

U.S. Equities market is shut for Juneteenth Holiday tonight.  That may have affected our volume today.


Saturday, June 18, 2022

Finspiration Australia. Chart Analysis for Australian and International Stock Markets.

      Weekly Wrap - Week ending 17 June, 2022.

XJO Monthly Chart.


XJO is into the third week of June.  The chart is bearish.

The monthly chart has broken down from its previous range 6930-7539, and finished the week at 6475

Both Supertrend Lines have turned blue (bearish).  All indicators are on the bearish side.

Weekly Chart.


The Index broke below support at the beginning of the week, and more or less, kept going down.  In the process it broke support of the 200-Week Moving Average.  Not a good sign.

RSI14 is now very oversold at 28.73 - which means there is some hope of a rebound, giving embattled investors the opportunity to sell stock at a higher price.

XJO has fallen -10.55% in the past two weeks.  That's the worst two-week period since the end of the 2020 Bear Market.

Monthly and Weekly Charts are in sync - bearish.

Daily Chart.


Both Supertrend Lines are blue and heading down, Hull MA13 is blue and heading down; 8-DEMA is also heading down.  There's not much joy in those moving averages. 

The double positive divergence on the MACD histogram and the MACD itself, which suggested a possible move to the upside, has now disappeared.  Another bearish indicator..

All three time frames are in sync - bearish.  Only take sell signals.  If there is a rebound, look to sell the rally.

With RSI14, Daily Chart, at 22.53 (an extremely low reading) a rebound is possible.


SP500.


On Monday, SP500 broke support and continued down for most of the week.

Two Supertrend Lines and HullMA13 are all blue (bearish).  A change to yellow would suggest a counter-trend rally.

Sector Changes - past week.


This chart shows this week's carnage across all 11 Sectors (plus Gold Miners, XJO, BEAR and IAF).  

No Sectors were up.  The two best performing sectors were both defensives, Telecommunications (XTJ) -2.35% and Consumer Staples (XSJ) -3.01%.  Calling XTJ a "defensive" was ok in the recent past, but its composition has been adjusted to include stocks like REA and SEK which are cyclical in nature rather than defensive.  At best, I think XTJ should be considered a hybrid, with some defensive stocks and some cyclical stocks.

Worst performers were Information Technology (XIJ) -9.81% and Energy (XEJ) -8.2%.  XEJ has been one of the best performers in recent weeks, but its run seems to have ended.

Financials (XXJ) is the biggest sector in the market and a major drain on the performance of the XJO.  XXJ has lost more than -15% in the past two weeks.  Until XXJ starts to perform positively, there's not much hope for the XXJ.  

New Highs - New Lows Cumulative.

This is one of the important breadth indicators.  Unless breadth is solidly positive, the market is always under threat.

NH-NL Cumulative continues to fall and is now well under its 10-Day Moving Average, that's a big red danger sign for long-term investors.  


ASX Advance-Decline Line.

This is another important indicator of breadth.


ASX Advance-Decline Line is also bearish, and in sync with NH-NL Cum.


% of Stocks above key moving averages.

1.  % of stocks above 10-Day Moving Average: Last Week 17%, This Week 5%.
2.  % of stocks above 50-Day Moving Average, Last Week 18%, This Week 3%.
3.  % of stocks above 200-Day Moving Average, Last Week 29%, This Week 21%


Once these instruments all fall below 20, that's a contrarian signal that the market might bounce.  Two out of three instruments are below 20.  It would be even stronger if the third one was below 20, but we are looking at a very weak oversold market, so the chance of a bounce is good.

At the end of the March 2020 bear market, % of stocks above the 200-Day MA reached just 5%.  This metric is currently at 21%, so it could go lower here.

Seasonally, we often see a medium term up-trend in stock markets.  I'd wait and see how this pans out.

Stocks and their RSI14s.

Bear markets like this are a boon to number geeks like me.  Some would say I take a ghoulish interest in the falls which are occurring.  But - there are some fascinating numbers turning up on the RSIs.

Above 70 (overbought) is considered overbought on the RSI14.  Currently in the ASX100, we have only two stocks which are both overbought (above 70), Crown and Atlas Arteria - both are under take-over offers which shot their charts into the stratosphere.  Effectively we have no stocks on the overbought Zone.

60-69 Zone.  Currently there are no stocks with RSIs in the 60-69 Zone.

50-59 Zone.  Currently there are just four stocks in this zone.  Two gold Miners (NCM, EVE),  WDS (Woodside - which is falling) and EDV (Endeavor - which is rising).  Gold Miners and EDV should attract interest from traders.

The 50 line on the RSI14 is often used in some trading strategies as a dividing line between bullish and bearish.

40-49 Zone.  About 9% of ASX100 stocks fall in this zone - bearish.

30-39 Zone.  This is the "Oversold Zone".  38% of ASX100 stocks fall into this zone.

20-29 Zone.  This is the "Very Oversold Zone".  34% of ASX100 stocks fall into this zone.  Rarely do stocks fall into this zone without rebounding.

10-19 Zone.  Holy-Moly Batman, these stocks are absolutely cactus.  10% of ASX100 stocks fall into this zone.

A contrarian will look at those numbers and think, "We're due for a rebound".  Contrarian signals don't provide highly reliable signals but they usually prove correct in the near future.  A rebound is close.  Watch for a break to the upside (above 20) on the daily Stochastic.


Conclusion.

1.  Monthly, Weekly and Daily Charts are all in sync - bearish.   Any rebound should be a signal to sell into the rally.

2.  Breadth is poor, so poor that contrarians will be salivating at the prospect of new buying coming into the market.  Contrarian signs are not always reliable, and sometimes well ahead of what could happen.  

3.  We need to see a move up on the Stochastic Daily chart for short-term traders to go long.


Finspiration Australia. 14/11/23. Tues. Morning Report.

Mixed Results in New York.  Energy up. NAB ex-dividend today. Dow Jones +0.16%.  SP500 -0.08%.  Nasdaq -0.11%.  Small Caps -0.07%.  Banks -0...