Weekly Wrap, Week ended 17/12/21. XJO rises from crucial level
XJO Monthly Chart:
XJO peaked in August, 2021. It has since fallen September-November, but is now resuming its bullish trend in December. This is important as it is moving up from a crucial long-term level - the 8-Month Exponential Moving Average. December tends to be a seasonally bullish month for the market, so we may see more upside.
XJO Weekly Chart:
The weekly XJO Chart shows a decline this week of -0.67%.
The chart shows a wide trading range which switched the weekly trend from up to sideways. A break above 7479 should be bullish. A break below the 50-Week Moving Average (blue, curving line) would be bearish.
Currently, this week's candle is in the middle of the trading range. This could go either way.
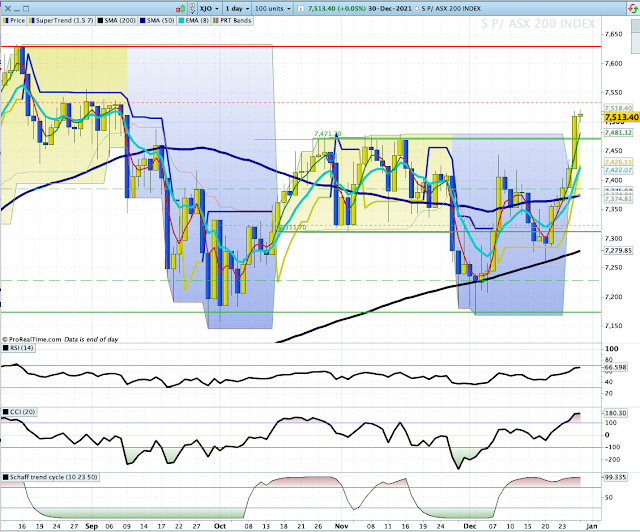
Daily XJO chart:
This week, XJO had two up days, two down days and one flat, but the down days overwhelmed the up days by -0.67%.
Given poor results in the U.S. on Friday night, we can expect a down day on Monday for our market. That could see a test of the crucial 200-Day Moving Average.
One Week Sector Changes:
This week saw four sectors up, one flat (Energy) and six sectors down. Health (XHJ) was the biggest loser, down -6.47%. That was partly due to a big fall in CSL on Thursday when it was down -8.16%. But some other stocks in XHJ also fell heavily. For the week, COH - 3.72%, RMD -5.13%, RHC -3.61%, FPH 2.89%.
The best two performing sectors were Materials (XMJ) +2.33% and Property (XPJ) +2.25%. Utilities (XUJ continues its recent good performance, up this week +1.4%.
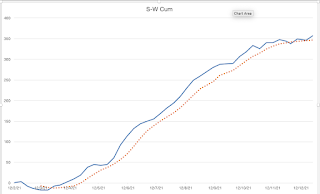
NewHighs-NewLows Cumulative.
For long-term investors, this is one of the most important charts to watch.
The Cum NH-NL is now sitting above its 10-Day Moving Average after a small rise this week. The chart is, however, trending sideways. Wait.
The Strong-Weak Stocks Chart fell this week, providing a dis-confirmation of the Cum NH-NL. We need to see congruence in those two charts to feel confident of direction
Stocks in the ASX100 above the 200-Day MA.
% of stocks in the ASX100 above the 200-Day MA fell this week from 60% to 53%%. That keeps it above the bearish level of 50%, but within comfortable striking distance of a bearish reading.
Cum Advances-Declines.
Cumulative Advances-Declines was up marginally this week, but remains in a bearish trend below its 10-Day Moving Average.
Conclusion: The XJO has been in a sideways trend for about three months. The past week has not changed that situation. Breadth Indicators (NH-NL, AD-DC, Stocks above 200-Day MA) are indecisive. Wait.
We're coming into a seasonally favourable period - the fabled "Santa Rally" may be upon us this week. The
Santa Rally refers to an historically significant rise occurring in the last week of December and the first two days of January
It's important, however, to trade what you see not what you think. Put ideas about "Santa Rally" to one side and watch the charts.