Weekly Wrap, Week ended 19/11/21. XJO remains range bound
Daily XJO chart:
This week, XJO was down -0.62%.
XJO has been range bound for over a month. The upper level is 7471. The lower level is 7312. That's a difference of 2.2%. That's a relatively narrow range. Range bound markets give way to trending markets. I wouldn't take much for the XJO to bust out of this range.
The medium term trend remains bullish (PRT bands are yellow), so position traders should maintain their current holdings.
One Week Sector Changes:
Despite the loss of -0.62% in the XJO this week, we can see that eight out of eleven sectors were up. So breadth was OK. The main drivers of the fall in the XJO were the two biggest sectors, Financials (XXJ) down -3.57%, and Materials (XMJ) down -1.65%. Energy was down -1.53%. (That's not much consolation to motorists who are still looking at record high prices at the petrol pump. When Energy prices go up, petrol companies seem to pass on the increase immediately, but when Energy prices go down, it seems to take forever for this falls to filter through to the service stations.)
This week we saw some of the banks go ex-dividend, but that doesn't explain much of the parlous state of the banks. CBA reported and fell -8.07% on Wednesday and then another -1.55% on Thursday. That had a flow-on effect to the other big banks (WBC, NAB, ANZ). WBC has been underperforming the market since late October. Since 28/10/21, WBC has fallen about -15%. BEN and BOQ have been on the nose for three or four months. Steer clear of the banks until we see definite signs of recovery. That may not be too far away. CBA has now fallen down to about its long-term average, the 200-Day MA.

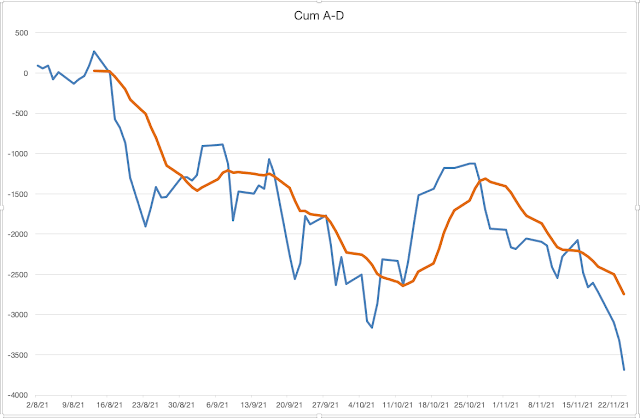
NewHighs-NewLows Cumulative.
For long-term investors, this is the most important chart to watch.
While the NH-NL remains above its 10-Day MA, long-term investors might feel comfortable in holding their investments. If it breaks below the 10-Day MA, they might then take defensive action.
This chart has kept investors in this long bull market dating back to mid-2020. It looked precarious recently when the XJO pulled back, but the NH-NL CUM didn't cross below its 10-Day MA. The two lines are once again well apart from each other. Long-term investments in Index ETFs look safe at this stage.
Stocks in the ASX100 above the 200-Day MA.
This chart shows that its been a tough time for investors for most of this year. Breadth is good, but just bobbing along with not a lot of direction. That's quite different from most of 2020, when the market had two distinct trends, the first one down (covid) and then the next one up (optimism about recover). For most of 2021, however, its been up and down without any clear direction. Maybe that will change in 2022.
Strong Stocks v Weak Stocks.
This is a development of my own making. I mark up all the stocks in the ASX100 according to seven criteria. Any stocks positive on all 7 criteria are regarded as Strong Stocks (SS). Any stocks negative on all 7 criteria are regarded as Weak Stocks (WS).
This week saw a turn-around in the SS v WS. In the previous week the Ratio was flat 10/10.This week the Ratio of SS v WS was 16/8. That's consistent with the Sector analysis above showing eight sectors up and only three down for the week.
This is a measure similar to the NH-NL Cum (above). It's a good guide for position traders rather than long-term investors. While the Strong-Weak Cumulative chart remains above its 10-Week MA, position traders can continue to hold Index ETFs. The only time this chart was in trouble this year was back in late March when XJO had a significant pullback.
Conclusion:
Our market remains range-bound, although some positives are emerging, with breadth looking better than the negative result for the XJO would suggest. While the two biggest sectors (XXJ and XMJ) remain under pressure, our market will have trouble making headway - but there are plenty of opportunities for stock pickers.
Those fears have abated this week, but remain lurking in the shadows.
The Federal Reserve announced its long-awaited taper - which didn't spook the markets and the Australian Reserve Bank maintained its long-term low-interest rate policy but jettisoned one of its bond market policies.