Wednesday, November 16, 2022

Finspiration Australia. Chart Analysis for Australian and International Stock Markets.

 16/11/22.  Finspiration Evening Report.

XJO falls for third straight day.


XJO down -0.27%.  Fall in the past three days have been relatively modest.  It might need to come off a bit more and wear down the overbought readings before traders see this market as being enticing to enter.


Financials (XXJ) were weak today - down -1.02%.  XXJ was the leading sector recently   It is slowly working off its overbought reading.  It might need to test the 200-Day MA before rebounding.

Energy (XEJ) was the best performing sector today, up +1.18%.  It is now in a sideways consolidation after topping out om 8 November.

NH-NL Cumulative.


NH-N Cum is tantalisingly close to rising above its 10-Day MA.  Close isn't good enough.

Wait for a decisive move to the upside.

It's early in the evening, but Dow Futures are currently up +0.25%.


Tuesday, November 15, 2022

Finspiration Australia. Chart Analysis for Australian and International Stock Markets.

 15/11/22. Finspiration Evening Report.

XJO finishes flat today.


XJO was down just -0.07%.

The Index has stalled at a major horizontal resistance level.

Two doji candle-sticks in a row coming at the top of a trend suggests more down-side.

On the plus side, PRT Bands have turned positive.  So any pull-back is likely to be bought.

New Highs and New Lows are now at an inflection point.


NH-NL Cumulative is now so close to a move above its 10-Day Moving Average.

A break above that would be bullish for long-term investors.


Monday, November 14, 2022

Finspiration Australia. Chart Analysis for the Australian and International Stock Markets. + Bitcoin.

 15/11/22.  Finspiration Morning Report.

Tech stocks weak - lead U.S. indices lower.  Iron Ore strong.  Bitcoin down.

U.S. Indices:


Dow Jones -0.63%.  SP500 -0.89%.  Nasdaq -1.12%.  Small Caps -1.11%.  Banks -2.3%.

SP500


SP500 has found resistance from a minor horizontal resistance level set up back in July this year.

Nearby is a major support level at 3900 (round numbers).  That served as resistance/support multiple times in the past six months.  Expect a bounce at that level.

The Index remains within the confines of an up-trending Andrew's Pitchfork but close to an up-sloping restraining line.  That's positive for the medium term outlook.

Commodities.


Commodities Index -1.49%.  Energy -2.96%.  Base Metals +1.41%.  Agriculture -0.05%.  Gold +0.22%.

Iron Ore +2.95%.

Those metal prices might soften the impact of weak U.S. Indices on the ASX today.

After one hour of trading, XJO is down -0.1%.

Bitcoin.


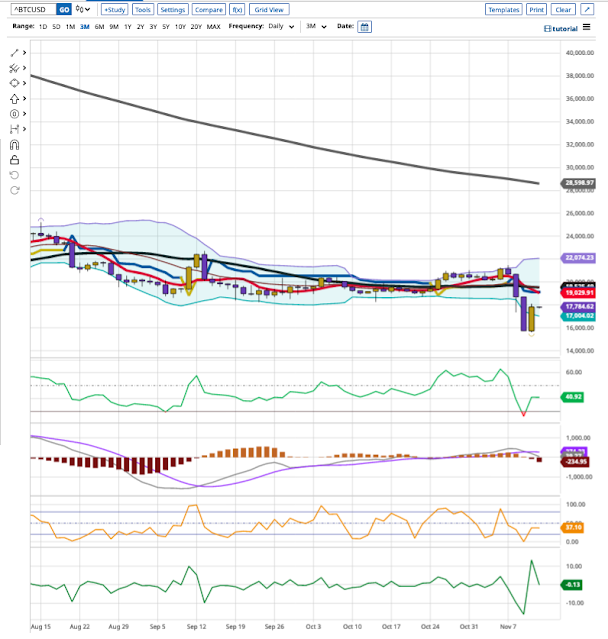
Bitcoin, on Monday, was up +1.75%.  It is consolidating at the lows with clear support and resistance levels on the above chart.  Watch for a break one way or the other for a new direction.

Finspiration Australia. Chart Analysis for Australian and International Stock Markets.

 14/11/22.  Finspiration Evening Report.

Australian market was flat today, down just -0.16% after being up higher in early trade.


Lots of pluses and minuses exist in this chart.

The XJO is at a major horizontal resistance level - the high from mid-August 2022.

On the other hand, the Index is well above the 200-DMA - that's a bullish event.  Any pull-back is likely to be bought.

ProRealTime Bands have now turned bullish.

Stay with the up-trend - buy dips.


Saturday, November 12, 2022

Finspiration Australia. Chart Analysis for Australian and International Stock Markets.

  6/11/22.  Sunday Report - The Week That Was.  Week Ended 11/11/22,

XJO Monthly Chart.


The down-trend in the Monthly Chart may have been reversed.

The Hull MA13 has turned up.  Remember that this was the first indicator to turn bearish back in October 2021.  If it can remain up at the end of the month, we will have had one significant change on the indicators.

This week, the chart has finished above the 8-Month Exponential Moving Average and above one of the Supertrend Lines.  Another bullish sign.  

If these gains can hold until the end of the month, we are entering a new bullish trend.

XJO Weekly Chart.


XJO had an exceptional week this week with the index up +3.58%.  That's the third week in a row that it's been up, and momentum is increasing not decreasing.

Hull MA13 and both Supertrend Lines are bullish.  The index has formed a double bottom

The Index has closed above the 50-Week MA which is a bullish signal.

XJO Daily Chart.


XJO has finished decisively above the 200-Day MA.  That's bullish.

RSI is at 67.08 - close to the overbought level of 70.  It might get over that given solid results in the U.S. on Friday.  

Look to buy pull-backs.

SP500 Weekly Chart


SP500 had a great week, up +5.9%.  It remains below its 50-Day MA and lags the XJO in that regard.  That's mainly because of the poor results in big tech stocks which have taken a caning in recent months.

Both Supertrend Lines are now bullish and Hull MA13 has turned up.  Those are bullish events.

SP500 was up +0.92% on Friday after its big rise on Thursday of +5.54%.

SP500 weekly is in an uptrend - Higher High and Higher Low.  Stay with the trend.

ASX Sector Results for this week.


It was a good week for the XJO with ten out of eleven sectors up.   The only negative sector was Energy (XEJ -2.24%).  It has been one of the leading sectors in recent times so a pull-back is to be expected.  

Financials (XXJ +0.92%) was a relative damp squib compared to some of the other sectors.  XXJ has been a leading sector, so we're probably seeing rotation out of that sector into some of the stronger ones.

Four sectors rose >5%.  (Materials, Health, Utilities, Property).  The big rise in Utilities was due to take-over activity in that sector. 

Relative Strength of Sectors.

RSI (Relative Strength Index) is calculated using the default setting of 14 days - almost three weeks of trading.  It provides a more reliable guide to changes in sectors than the one-week results which can jerk around quite a lot and, thus, RSI is probably a better guide to recent strength in the sectors. (Click here for a description of RSI.)


 All eleven sectors are above the 50 level - that represents a bullish result.  

The strength in Utilities comes up clearly again in this graph.

Gold Miners (XGD) is above RSI/70 so it is well overbought.  We might see a pull-back in the leaders in the XGD leaders group, e.g., NCM and NST.


NewHighs-NewLows Cumulative.


This is a lagging indicator but bullish signals are usually highly reliable.  

This is a metric for the long-term investor.  While NH-NL Cumulative remains below its 10-Day Moving Average, it is best for long term investors to remain cautious and defensive regarding the market.

The gap between the NH-NL Cum and the 10-Day MA has narrowed down so a new bull signal may not be far off.

% of Stocks above key moving averages.

1.  % of stocks above 10-Day Moving Average: Last Week 59%, This Week 83%.  
2.  % of stocks above 50-Day Moving Average, Last Week 58%, This Week 83%.  
3.  % of stocks above 200-Day Moving Average, Last Week 35%, This Week 44%.  

The two shorter term measures (Nos. 1 & 2) are now >80%.  That's an overbought signal.  Expect some weakness in the market in coming days.  

Stocks >200Day MA have improved above the crucial 40% level.  That suggests that any pull-back will be bought.


% of stocks above the 200-Day MA rose again this week.  Steady improvement can be seen in the bar chart and the 5-Week MA is rising.  

Conclusion.
 
The ASX is now looking bullish.  We can expect more upside early next week,  but the ASX market in the short term, is now at or close to being overbought - depending on how you measure it.  Expect a pull-back in the near future - and that will probably be a chance to buy into this market.


Stay Safe

Friday, November 11, 2022

Finspiration Australia. Chart Analysis for Australian and International Stock Markets + Bitcoin.

 12/11/22.  Finspiration Morning Report.

Overnight stocks extend rally.  Commodities rise.  Bitcoin pulls back.

Dow Jones +0.1%.  SP500 +0.92%.  Nasdaq +1.88%.  Small Caps +0.56%.  Banks +1%.

SP500.


SP500 is in an up-trend from mid-October.  It seems headed for the 200-Day MA.  (DJ is already over that level.) 

We are now in a buy-the-dips scenario.  

Commodities.

Commodities Index +1.91%.  Energy +2.09%.  Base Metals +3.08%.  Agriculture +0.25%.  Gold +0.66%.

With both stocks on commodities on the rise, we should have another good day on the ASX on Monday.

Bitcoin.


Bitcoin fell back -5.84% overnight.  This remains a day-trader's market.  Long term investors might look elsewhere.


Stay Safe

Thursday, November 10, 2022

Finspiration Australia. Chart Analysis for Australian and International Stock Markets + Bitcoin

 11/11/22.  Finspiration Morning Report.

 - Whooshka!.  

Overnight in America  - Whooshka!.  


Dow Jones +3.7%.  SP500 +5.54%.  Nasdaq +7.35%.  Small Caps +5.9%.  Banks +5.75%.

Dow Jones.


DJ is now well clear of the 200-Day MA.  That's one criteria often taken of a bull market.

The Index may be forming a rising wedge - which is bearish.  We'll have to monitor that to see how it develops.

Commodities.


Commodities Index +0.9% - finding support at the 20-Day MA.  Energy +0.85%.  Base Metals +1.76%.  Agriculture +0.3%.  Gold +3.04%.

Overnight ASX Futures suggest that our market will open about +2% higher.

Bitcoin.


Along with other risk assets, Bitcoin had a great night, up >13%.  This is a great avenue for day traders. Big money to be made.

For the longer term, the future of Bitcoin remains dubious.  Plenty of overhead resistance to be overcome before it looks bullish again.

Finspiration Australia. 14/11/23. Tues. Morning Report.

Mixed Results in New York.  Energy up. NAB ex-dividend today. Dow Jones +0.16%.  SP500 -0.08%.  Nasdaq -0.11%.  Small Caps -0.07%.  Banks -0...