Monday, November 6, 2023

6/11/23. Monday Evening Finspiration Report.

 XJO up modestly today +0.28%.  STW (ETF for STW) up +0.25%.


STW inched closer today to major horizontal resistance and is opposite Point of Control on The Volume Profile to the left of the chart.

Tomorrow is RBA interest rate decision day (and Melbourne Cup).  STW is at an inflection point, so the Interest Rate decision will likely be decisive for the near-term direction of the market.

Health (XHJ) was the best performer today, +1.47%, while Energy went the other way -0.97%.

Woodside is the largest stock in Energy.  Here's the chart:


There's no clear sign yet that WDS is ready to turn around, but it is oversold so a rally may not be far off.

In early overseas trading, Europe its flat (STOXX500 +0.09%) and Dow Futures up a little +0.12%.

Saturday, November 4, 2023

5/11/23. Weekly Finspiration Report

 Major Stock Markets around the world have had a great week, e.g.,  XJO +2.22%.  SP500 +5.85%.  European STOXX600 +3.41%.  Japanese Nikkei +3.18%.

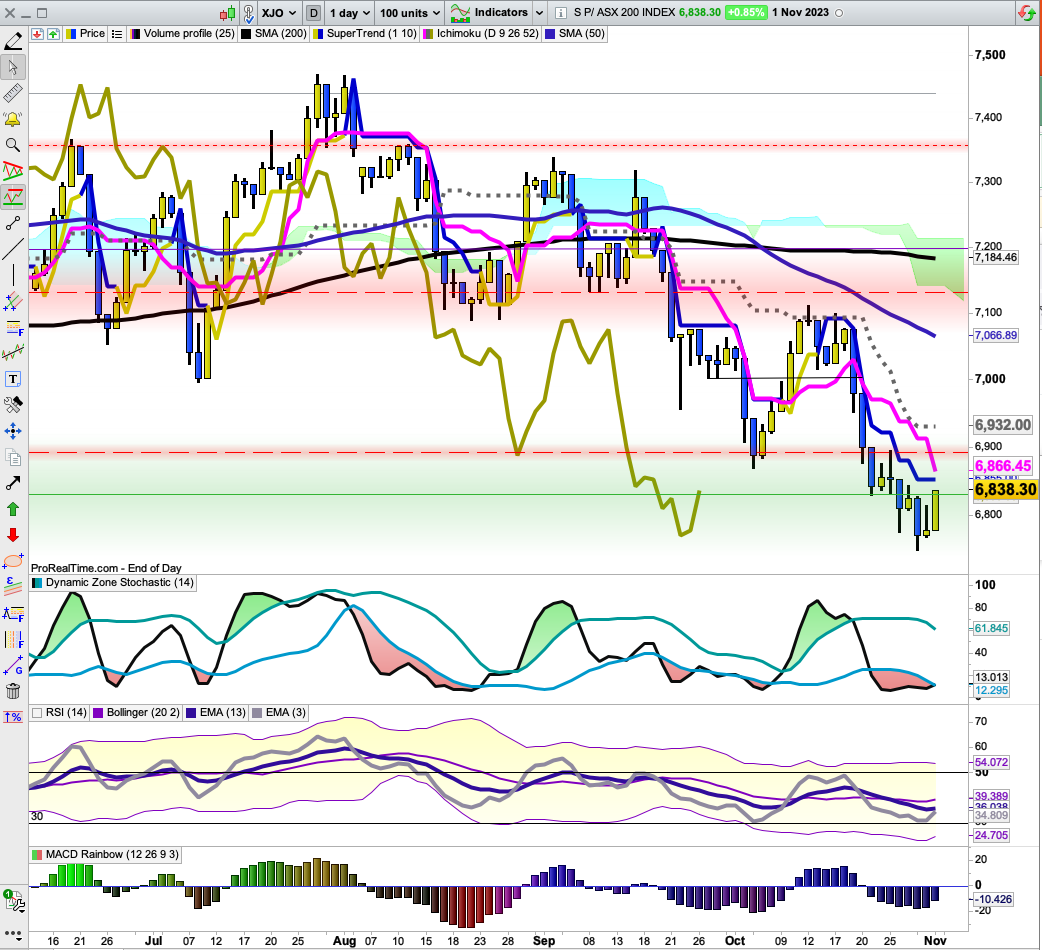
STW Daily Chart (STW is an ETF which tracks the XJO)


STW broke above its Bullish Falling Wedge on Friday.  The chart had already given two "buy" signals, the first on Wednesday when the DZ Stochastic crossed above its lower band, and then the second one on Thursday when we had a double Supertrend "buy" signal. 

Friday was a heavy volume day which spiked the Force Index and the Volume Index to high levels.  That usually occurs when the market is setting up for a consolidation or pull-back.

Given Friday's big gain on the SP500, it seems likely that the XJO will hit Horizontal Resistance and go into consolidation or pause mode.

SP500 Daily


Force Index gives good divergence signals.  That played out this week, when SP500 began a counter-trend rally on Monday after a good positive divergence signal appeared on the Force Index the previous week.

SP500 has had a big rise this week and is now at horizontal resistance and resistance from the 50-Day MA.

Expect consolidation or a pull-back in the coming week.

Is this a dead-cat bounce?  

We never know until after the fact.  At this stage we have a counter-trend rally.  We need to see a definite uptrend form with a higher low and a higher high on the SP500.  Given the strength of the current rally - that seems likely after the market absorbs some of the current rise.

Sector Performances this week.

The place to be this week was in Materials, esp. the big miners.  XMJ up +0.87%.  That was the only positive sector.


Resurgence of Property continued this week, XPJ +6.88% followed by Information Technology up +4.51%.  Those are two interest rate sensitive sectors - buoyed by suggestions that the Fed. may have reached the end of its interest rate hikes and no rise in Ozzie rates this week.  IT also received a big boost by Block (SQ2) rising by >25% on Friday.  XPJ and XIJ were the worst performers the previous week.

Sector Momentum 


If a sector is in a counter trend rally, then the Daily RSI is above the Weekly RSI, but Weekly RSI is below the Monthly RSI, then I assume that the Sector is in a counter trend rally.  That doesn't mean it can't develop into a full blown up trend.  That would require the Weekly RSI to be above the Monthly RSI - it just hasn't happened yet.  It might on might not.

SECTORS in Counter-Trend Rallies:  Financials, Materials, Information Technology, Communications Services, Health, Staples, Property, Industrials.  XJO and Composite Bonds are also in Counter-Trend Rallies.  Sector closest to develop a full blown up trend is Property.

SECTORS in Down Trends:  Energy, Utilities.  Gold Mining is also in a down trend.

No Sectors are registering an up-trend.

100 Leader Stocks above their 200-Day, 50-Day and 10-Day Moving Averages.

  • Above their 200-DMA:  last week 34%, this week 36%.
  • Above their 50-DMA:  last week 12%, this week 32%
  • Above their 10-DMA:  last week 19%, this week 81%.
Stocks above 10-DMA is into overbought territory (above 80%) so the market could see some consolidation or a pull-back.

Long Term Market Signal.

 
My long-term Market Signal is based on the NeewHighs-NewLows Cumulative Chart with a 10-Day MA.  When the chart moves back above its 10-Day MA a "buy" signal is given.  It is usually reliable for long term investors.  It did have a whipsaw Aug/Sept this year but that is a rare anomaly.

The chart is currently in a steep down-trend.  New Lows are, however, rapidly disappearing, so we could get a new buy signal in the near term if the market continues to make ground.


Conclusion.
 
The Australian market has risen strongly this week - perhaps a little too strongly.  It probably needs a consolidation before (if) it is to resume its up trend.  If a higher high and higher low appears on the XJO/STW Charts, that would provide a sound medium term "buy" signal.  Given the strength of this week's rise with strong volume - I think we will see a new uptrend develop. 
 
Good Luck.

Friday, November 3, 2023

4/11/23. Saturday Finspiration Report.

 Yesterday was Jobs Day in the U.S.  and the employment figures came in weaker than expected.  Bad News = Good News for the U.S. stock market.  Dow Jones has been up five days this week - its best week in more than a year.


 Dow Jones +0.66%.  SP500 +0.94%.  Nasdaq +1.38%.  Small Caps +2.73%.  Banks +3.07%

SP500


SP500 has had a great run this week.  Now it is running into multiple resistance levels, horizontal resistance, 50-Day MA and the Kumo Cloud.  Expect a pause or pull-back here.

Commodities.

Commodities Index -0.52%.  Energy -1.71%.  Base Metals +0.49%.  Agriculture +0.72%.  Gold +0.36%.

Overnight in the U.S., BHP +1.23%.  Rio +0.77%.  Woodside +0.47%. 

Yesterday in Australia.

XJO was up strongly yesterdayXJO +1.14%.  STW (ETF for XJO) +1.18%.


The Candle Volume for STW was very wide.  Force Index and Volume are at very high levels.  These volume studies suggest that STW (and XJO) are at or close to a short-term high.

STW is near a horizontal resistance level.  Given overnight action in the U.S. that horizontal resistance level is likely to be hit - and that might result in a consolidation or pull-back in STW and XJO.


Thursday, November 2, 2023

3/11/23. Friday Morning Finspiration Report.

 Last night, U.S. markets continue their upside move.  All three major indices were up strongly.


Dow Jones +1.7%.  SP500 +1.89%.  Nasdaq +1.79%.  Small Caps +2.66%.  Banks +4.46%

SP500

SP500 up for the fourth day in a row.  It is now at a major resistance level and close to the Value Zone and Point of Control.  We could get a reversal day on Friday.

Commodities.

Commodities +1.06%.  Energy +2.11%.  Base Metals -0.05%.  Agriculture +1.18%.  Gold +0.33%.

After an hour of trading this morning, XJO is up +0.92%.  Property is again leading the way, up +2.38%.  Energy is down, -0.2% and Staples is down, -0.36%.  Financials up, 0.99%.


2/11/23. Thur. Evening Finspiration Report

 Strong Oz market today.  XJO up +0.9%.

Here's the STW Chart (ETF for XJO).


STW gapped up on the opening after the Federal Reserve interest rate announcement.  A bit of intra-day selling came in during the day as the STW hit the Tenkan San (Base Line of the Ichimoku System).   Momentum might slow here.

Oz Vix has now broken below its up-trend line - another bullish sign.


IT was the best performing sector today +3.23%.  IT is a "growth" sector - good to see a growth sector leading the pack.

Second best today was Property,  XPJ +2.36%.  Property continues as a leading sector.

VAP had a false break below the Value Zone of the Volume Profile (big shaded rectangle on the chart).  When that happens the chart usually heads up to the top of the Value Zone.

VAP currently at 72.15.  Top of Value Zone 78 (round number).  That's a sizeable rise from the current level.

Only caveat - VAP is now at the Point of Control - that might cause a few problems.  If VAP rises above that, top of the Value Zone shouldn't be a problem.

Good luck.


Wednesday, November 1, 2023


Dow Jones +0.67%.  SP500 +1.05%.  Nasdaq +1.64%.  Small Caps +0.45%.  Banks +0.13%.

SP500


SP500 has had three days to the upside and has now reached the Kijun Sen (Base Line of Ichimoku System),  DZ Stochastic is above its lower line and headed up.  RSI is also rising.  Looks good to me.

Commodities.


Commodities Index +0.15%.  Energy -0.49%.  Base Metals +0.93%.  Agriculture -0.14%.  Gold +0.32%.

After 90 minutes of trading this morning, XJO is up strongly +1.3%.

1/11/23. Wes. Evening Finspiration Report.

The ozzie market had a rare show of confidence today despite the looming Federal Reserve decision tonight.  XJO up +0.85%. 

XJO has been in a lengthy down-trend since August (three months), but we now seem to have the start of a counter-trend rally (at least).  It still has a lot of work to develop a strong bull up-trend.

XJO has formed a three day reversal pattern at the end of this down-trend (big down day, doji, big up day).  That's usually a reliable reversable pattern.

The index is coming off a very oversold condition.  RSI was below 30.  That also suggests we'll see a good rally.

We'll just have to wait and see if this is a rally which should be sold into.  

Nine out of eleven sectors were up today, led by Property +1.85%, followed by Health +1.45%.  Those have been two beaten down sectors.  Perhaps they are now taking over leadership roles.

European stocks are up a little in early trading.  STOXX600 +0.17%.  Dow Futures -0.37%.

Oil is up +0.75%.  That fits with a down sentiment on the Dow.  It looks like the Americans will need a boost from Fed Head Powell if it is to get back into positive territory.

Good Luck


Finspiration Australia. 14/11/23. Tues. Morning Report.

Mixed Results in New York.  Energy up. NAB ex-dividend today. Dow Jones +0.16%.  SP500 -0.08%.  Nasdaq -0.11%.  Small Caps -0.07%.  Banks -0...