Monday, October 30, 2023

31/10/23. Tues. Morning Finspiration Report.

 American and European stocks rise.  Energy down.  Gold down.


Dow Jones +1.58%.  SP500 +1.2%.  Nasdaq +1.16%.  Small Caps +0.63%.  Banks +1.91%.

SP500


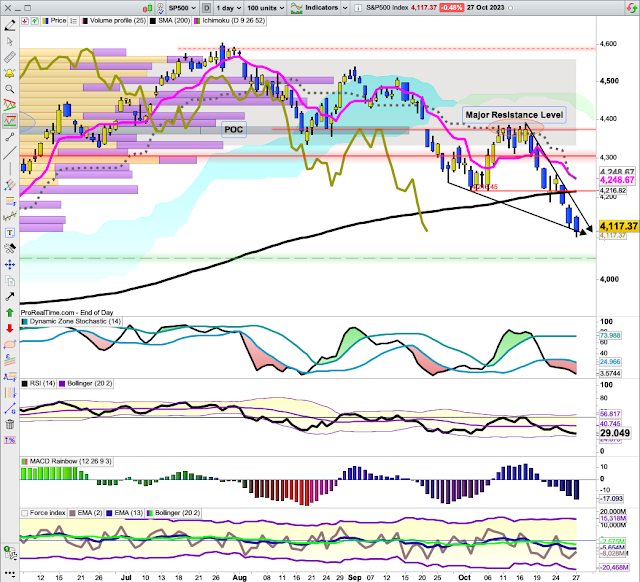
The last two days show a two-day bullish pattern (last night's positive candle finished well above the opening of the previous session bearish candle).  The down trend restraining line has broken to the upside.  Force Index is rising.  

I'd like to see DZ Stochastic close above its lower band and Supertrend switch from blue to yellow.

Commodities.


Commodities Index -1.6%.  Energy -2.55%.  Base Metals +0.65%.  Agriculture -0.69%.  Gold -0.56%.

After 45 minutes of trading this morning, XJO is up about +0.6%.  Ten out of 11 Sectors are up.


30/10/23. Monday Evening Finspiration Report

 XJO down -0.79% but well off its lows.  IT up +0.43%.  IT was the only Sector up today.  Materials (XMJ) finished more or less flat -0.09%.  Energy (XEJ) was the biggest drag on the market, -2.59%.  Gold Miners (XGD) up strongly +1.46%.

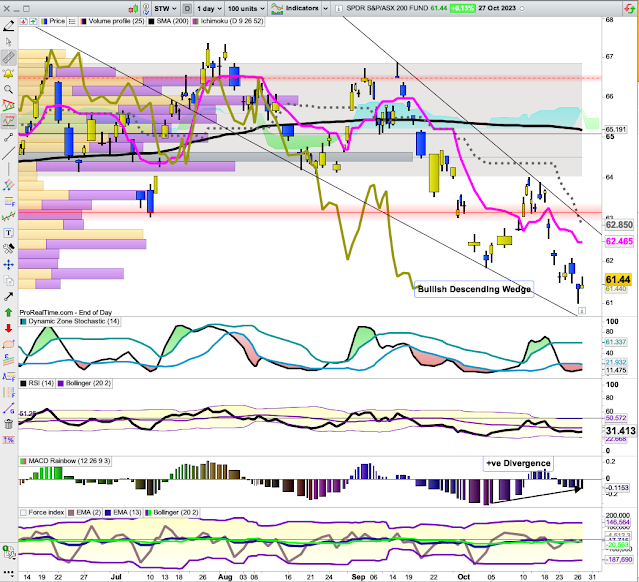
STW Chart:

STW remains within its Descending Bullish Wedge.  Wait for a break above its oblique restaining line.  That may not happen until after Wed. Federal Reserve interest rate announcement.
 

Sunday, October 29, 2023

29/10/23. Weekly Finspiration Report.


XJO fell this week, -1.07%.  XJO is close to falling into correction territory, down ~9% since its high on 27 July.  

SP500 in America fell -2.53%.  SP500 is now in correction territory having fallen ~11% since its high on 27 July.

Interest rate policies here and in the U.S. are the major factors affecting the direction of the stock markets, but the geo-political events in Ukraine and the Middle East complicate and deepen bearish sentiment.

The Oz market was down three out of five days, one of those days (Wednesday) was only barely down -0.04%.  The American market (SP500) was down four out of five days.

XJO is now -5.05% below its 200-Day SMA - well into bearish territory.  SP500 is -2.36% below its 200-Day SMA.  Such conditions assume the best trading strategy is to sell any rallies.  We are, however, into a bullish seasonal time, so the received "wisdom" might be taken advisedly.

STW Daily Chart (STW is an ETF which tracks the XJO)


STW is setting up for a swing higher rally.  It is showing a Bullish Falling Wedge which has a reasonably reliable record.  MACD Histogram is showing a strong positive divergence as is the 3-Day EMA of the Force Index.

Look first for a cross by the Dynamic Zone Stochastic above its lower band and then a move by the Chart above the oblique restraining line of the Descending Wedge.

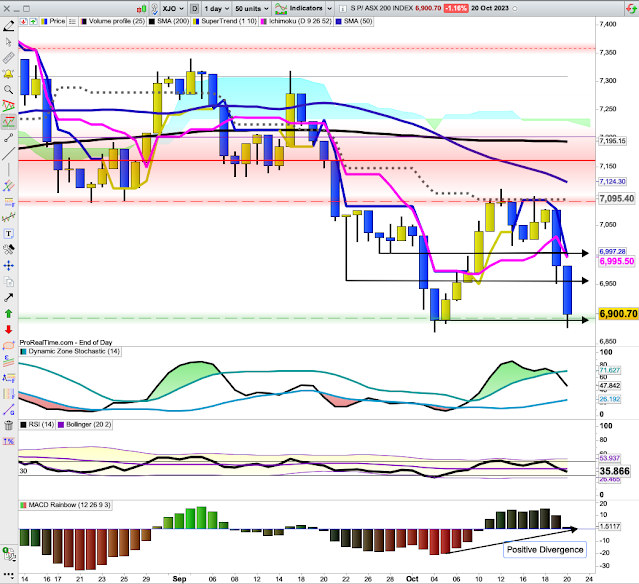
XJO Daily Chart.


XJO held up reasonably well for the first three days of the week, but sliced through important support t 7000 (round numbers) on Thursday.  On Friday, it continued down through the next support at 6957 to finish at the next important support of 6900.

Positive divergence on the MACD Histogram suggests the next move will be to the upside.

SP500 Daily


SP500 also shows a Bullish Descending Wedge.

The Index has closed in a relatively low volume zone which might be tempting for bullish traders to enter trades and push the Index to the upside.  A major resistance zone at the top of the wedge might proved a difficult level to overcome as it coincides with the Point of Control (heavy volume) on the Volume Profile over on the left of the chart.

A horizontal resistance level also lies at around 4217 which coincides with the 200-Day MA - so that may also prove to be a difficult first level to overcome.

The next Federal Reserve (U.S.) meeting is a two-day meeting on 31 October/1 November.  That may be a catalyst for a significant market move.

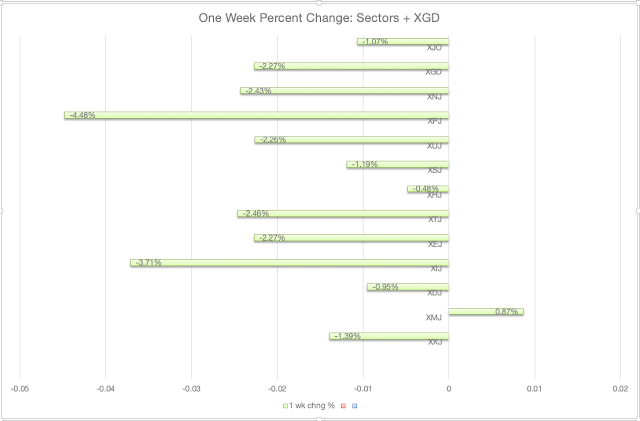
Sector Performances this week.

The place to be this week was in Materials, esp. the big miners.  XMJ up +0.87%.  That was the only positive sector.


The worst performing sector was the interest rate sensive Property (XPJ) -4.48%.  IT, another interest rate sensitive sector, was down -3.71%.

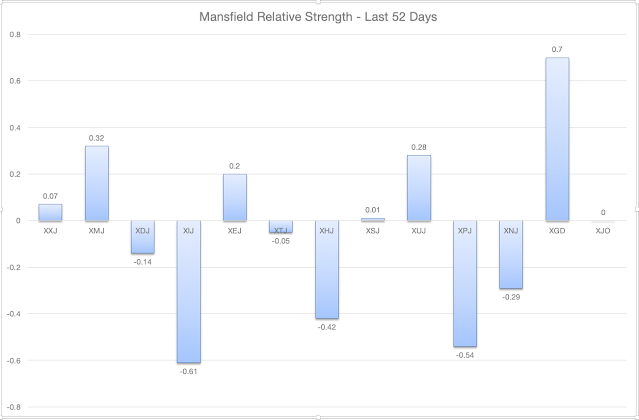
One Week data can be volatile and not necessarily give a good picture of medium term activity.  Mansfield Relative Strength over 52 Days gives a better understand.  MRS measures the activity of an Index against the XJO.  Above zero is positive and below zero is negative.

On this measure, Materials (XMJ) continues to win out, but several other sectors are also positive:  Financials (XXJ) Energy (XEJ), Staples (XSJ), and Utilities (XUJ). 

IT (XIJ) and Property (XPJ) remain the worst performers over this longer term.

100 Leader Stocks above their 200-Day, 50-Day and 10-Day Moving Averages.

  • Above their 200-DMA:  last week 32%, this week 34%.
  • Above their 50-DMA:  last week 21%, this week 12%
  • Above their 10-DMA:  last week 19%, this week 19%.
The last time we saw only12% of stocks above their 50-DMA was back in September, 2022 - over 12 months ago.

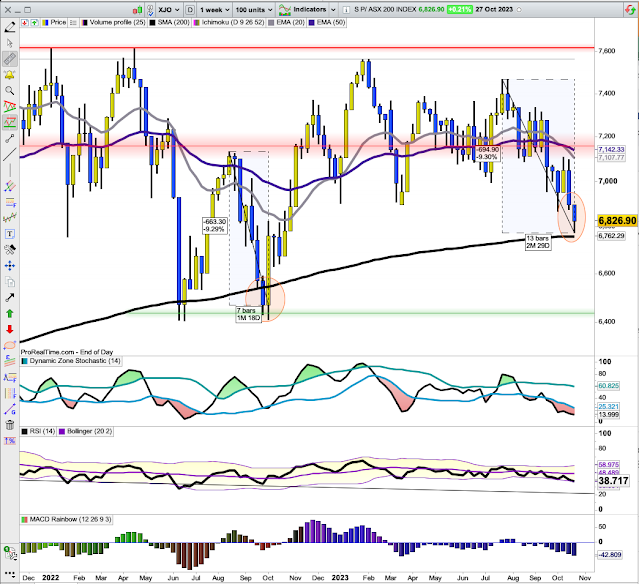
I've marked that time on a weekly chart of XJO below:


Sept. 2022 also marked a test of the 200-Day MA.  XJO is currently in a similar situation now.  The fall in 2022 is also similar in magnitude to the current fall, about 9%.  The 2022 fall took a short time, however, than the current fall - 7 Trading Days compared to 13 Trading Days for the current fall.  
 
Given the poor performance ot the American market on Friday night, it seems likely that XJO will hit the 200DMA on Monday.  Watch for a rebound sometime in the middle of the week - hopefully after the Federal Reserve Interest Rate decision (Wed. night Oz time.)


Conclusion.
 
The Australian market has been falling heavily and is almost into correction territory (down >10%).
 
Signs exist which provide some optimism, but price action is always the final arbiter.  Watch for XJO to break above oblique restraining line of the Descending Wedge marked on the Daily Chart. 
 

Friday, October 27, 2023

 Yesterday, XJO up +0.21%, Dow Jones down -1.12%, Nasdaq up +0.38%, Energy up +1.4%, Gold up +1.16%, US Dollar flat.

Below is a weekly chart for XJO:


XJO is down -1.07% for the week.  

It is at the Oblique Supporting Trend Line and close to the 200-Week Moving Average.  That suggests we should see an upside move in the near future.  

U.S. Indices.

U.S. Indices were mixed overnight with Dow down and Nasdaq up.


Dow Jones -1.12%.  SP500 -0.48%.  Nasdaq +0.38%.  Small Caps -1.01%.  Banks -2.34%.

RSIs for Dow and SPX are both below 30 - extremely oversold.  They don't go much lower without a rebound.  It probably all depends on geo-political events.

SP500


The 3-Day EMA of Volume continues to rise and is well above the 13-DEMA and the 20-DSMA.

That suggests we are close to a selling climax which should see a rebound.

Watch for the 3-Day EMA of Force Index to rise above the 20-DSMA and for the Dynamic Zone Stochastic fo rise above its lower band.

Commodities.


Commodities Index +1.34%.  Energy +1.4%.  Base Metals +1.38%.  Agriculture +0.92%.  Gold +1.16%.

Gold is now into the overbought zone with a RSI at 74.53.  This may be suggesting that its state as a safe haven may be coming to an end.

Energy is sitting around its 50-Day MA, i.e., about mid-range of recent activity.  That's a bit surprising given the current turmoil in the Middle East.  A candle-volume chart, however, shows a somewhat different picture:


Energy had huge volumes Thursday and Friday, a week ago.  That suggests that the current uptrend which began when Hamas invaded Israel in early October may be coming to an end.  Those huge volume occurred at a significant resistance level.  Energy has pulled back a little since then on lower volume, but Wednesday was a very volatile day.

MAs on the Force Index (three of them) are all sitting mid-range.  This could go either way, but given the big volumes a week ago, it wouldn't take much to nudge DBE lower.  That would be a plus for the American market.

Thursday, October 26, 2023

26/10/23. Thursday Evening Finspiration Report.

XJO finished down -0.61% but well off its early lows.

RSI is well oversold currently sitting at 31.18.  Currently, it is showing a small positive divergence from the low of 6 October, the date of the incursion by Hamas into Israel.  MACD Histogram also shows a positive divergence.

The index is in a long down-trend from early August, currently down -9.27%.  That's close to the "official" definition of a correction -10%.

This appears to be setting up for a rapid reversal to the upside.  Wait.

Yesterday, we saw some disappointing inflation figures - higher than expected.  That may put pressure on the RBA to raise interest rates.

RBA Governor Michelle Bullock gave a speech today which was relatively dovish - not what was expected.  As a result, likelihood of a rate hike fell to 31%.

Only two sectors were up today, Utilities +1.3% and Materials +0.14%.

Worst sector today was IT -2.56% and Property -2.07%.  Both are interest rate sensitive sectors.  I guess they didn't read the RBA memo.  :)

Europe is down heavily in early trade.  STOXX600 -0.95%
 

Wednesday, October 25, 2023

26/10/23. Thursday Morning Finspiration Report.

 U.S. Stocks fall into negative territory, with Nasdaq down strongly.

Dow Jones -0.32%.  SP500 -1.43%.  Nasdaq -2.43%.  Small Caps -1.26%.  Banks -0.3%.

SP500


SP500 remains in a down-trend - but is oversold so we could see a counter-trend rally.

MACD Histogram and Force Index are both showing positive divergences, so that reinforces the idea that we will see a counter-trend rally.

Commodities.


Commodities Index +0.73%.  Energy +1.36%.  Base Metals -0.11%.  Agriculture -0.46%.  Gold +0.42%.

Energy is usually inversely correlated to Stocks.  Energy up, Stocks down.

After an hour of trading this morning, XJO is down about -0.6% but off its lows.


25/10/23. Wed. Evening Finspiration Report.

 Well - it could have been worse, i.e., the inflation numbers today.  But they were bad enough, and blew up a promising start to the Ozzie market this morning.  XJO finished flat -0.04%.


The long upper and lower wicks on the small bodied candlestick today gives some idea of the violent jerking around suffered by the market today.

Yesterday's candle was an inside day (range inside the range of the previous day).  Today's candle remained within the range of Monday.  So nothing much has changed.  Look for a break of today's high or low for some idea of future direction.


Finspiration Australia. 14/11/23. Tues. Morning Report.

Mixed Results in New York.  Energy up. NAB ex-dividend today. Dow Jones +0.16%.  SP500 -0.08%.  Nasdaq -0.11%.  Small Caps -0.07%.  Banks -0...