Tuesday, October 24, 2023

25/10/23. Wed. Morning Finspiration Report.

 Positive results overnight in the U.S.  Energy down - that's good for the U.S. market.  Gold down.


Dow Jones +0.62%.  SP500 +0.73%.  Nasdaq +0.93%.  Small Caps +0.66%.  Banks -0.03%.

SP500


SP500 has bounced nicely off the 200-Day MA and horizontal support.  That's a good start.  It needs a lot more work to prove its bullish credentials.

Commodities.

Commodities Index -1.09%.  Energy -1.94%.  Base Metals +1.33%.  Agriculture -0.09%.

After an hour of trading this morning, XJO is up nearly +0.4%.

Late news:  XJO has now plunged - as at 11.30 is down about -0.2%.  Inflation figures must have been bad for the markets - interest rates to rise?
 

24/10/23. Tuesday Evening Finspiration Report.

 ASX had a low volatility day today after three days of high volatility.  XJO up +0.19% but well off session's high of +0.5%.


Today was the narrowest range of the past four days and an inside day.  Notation for such an event is ID/NR4.  This is an infrequent pattern.  A break above or below from the high/low of today should involve an increase in volatility and provide short-term direction.   Click here for more on this pattern.

Given that the XJO is oversold and showing a positive divergence on the MACD Histogram, I would think that the most likely direction is up.

Six Sectors were up today.  Best was Materials (XMJ) +0.85%.

The five Sectors down today were:  Staples -1.02%, Utilities -0.51%, Health -0.29%, Property -0.23% and Communications -0.2%.  There's a bias in that group to Defensives.  So we had some switching today out of Risk Off into Risk On.  That's a positive sign.

Economic data out today showed a slowing in the economy.  Manufacturing PMI down from 48.7 in September to 48 in October.  Services PMI dropped from 51.8 in September to 47.6 in October.  Numbers above 50 indicate expansion.  Under 50 indicates contraction.  That's good news for interest rates (going down) but bad news for the economy.

In early Tuesday trading in Europe, stocks are down a little, STOXX600 -0.17%.  Dow Futures up +0.24%.  That's not necessarily a great guide to what will happen today as we've seen in the past.

It will be a busy night (Oz Time) for company reports in the U.S.  Some of the biggies coming Tues. are: Microsoft, Alphabet, Visa and Coca-Cola.  Those reports could be market moving.


Monday, October 23, 2023

24/10/23.

 Last night in America major indices finished mixed.  After the lunch session the major indices were all at least marginally higher, but afternoon trading sent Dow Jones and SP500 into negative territory while Nasdaq remained positive.

Sydney Futures finished in negative territory.

America Last Night.


Dow Jones -0.59%.  SP500 -0.17%.  Nasdaq +0.27%.  Small Caps -0.95%.  Banks -0.95%.

SP500


Last night's candle shows long wicks on top of a narrow body.  That's indicative of a major battle taking place between opposing forces (bulls and bears).  It is notable that the battle is taking place right at the 200-Day MA - usually taken as the dividing line between bull and bear market.

2-Day EMA of Force Index was low enough on Friday to suggesst a possible low (below bottom Bollinger Band).  It moved up last night.  It needs to get above both the 13-Day EMA and the centre line (20-DMA) of the Bollinger Bands to feel sure that a low is in place.

Commodities.

Commodities Index -0.64%.  Energy -1.74%.  Base Metals -0.11%.  Agriculture +0.05%.  Gold -0.34%.

After an hour of trading today XJO is up about +0.3%.
 

23/10/23. Monday Evening Finspiration Report.

 In my Weekend Report yesterday, I as relatively optimistic about the medium term outlook for the Australian market.  The ASX today was down again heavily and clearly finished below the 6900 support level, which is a bearish event.

So - have I changed my mind.  Not at this stage.  I'm getting more and more bullish non-confirmations of this bearish fall on a number of indicators that I keep.  Some of these are arcane, but do add further weight to the thesis that we're not far from a turn-around.  Tuesday is often called Turn-Around Tuesday by technical analysts.  We'll see tomorrow if Tuesday lives up to its nick-name.

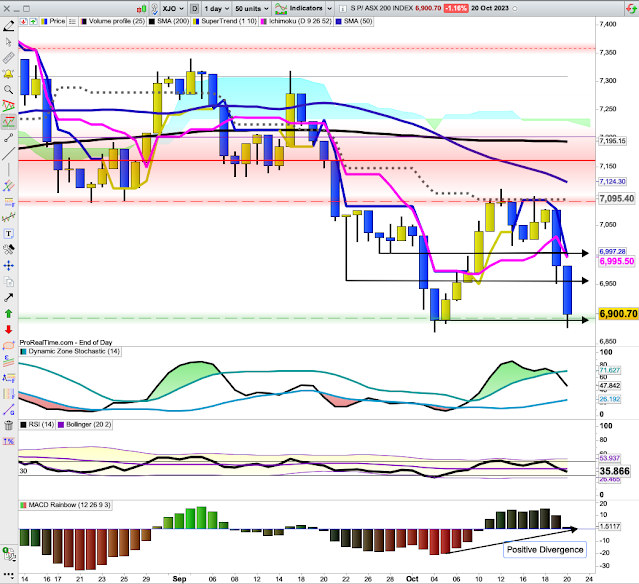
Here's the chart for XJO today:


 The chart is clearly below the major support level of 6900 (round figures).  We still have that pesky positive divergence showing on the MACD Histogram which suggests we're not far off a bottom.

Here are a few more charts with positive divergences which suggest that the ASX is not far off a bottom.

Above is a chart for NewHighs/NewHighs+NewLows.

I put a fair degree of weight on this data set.  A positive divergence between the low of 6/10/23 and now is clear on the chart.  6/10/23 was the date of the major Hamas incursion into Israel.

Historical Volatility

Volatility is usually expected to rise during times of crisis.   Volatility acts inversely to the stock market. Yes, HI has risen but is still well below the height seen in early October, and nowhere near periods of bearish sentiment back in July and March.


 Bonds/Stocks 

In crisis periods we expect Bonds to outperform Stocks.  Bonds are considered a "safe haven" in times of crisis.  Below is the chart of the ratio of Bonds/Stocks.


 Since early October, Stocks have performed surprisingly well compared to Bonds.  The Ratio of Stocks/Bonds was deeply negative in early October - now it is slightly positive in favour of Stocks.  Curious.  

Health.

The big surprise in the market today was the good performance of the Health Sector which has been in the dog house for many months.  Today XHJ was the best performing Sector on the ASX, XHJ up +1.53%.  This might just be a turning point for Health for long-suffering investors in Health Care Stocks.  Still - we need to see a new up trend develop before getting too excited.  But a bullish engulfing pattern coming at the end of a long down trend is a good start.  And, we have a confirmed positive divergence on the MACD Histogram, i.e., the histogram is moving up from a higher low.


  Good luck


Saturday, October 21, 2023

22/10/23. Weekly Finspiration Report.

 The past week was negative for the Australian stock market, with big falls occurring on Thursday and Friday/

XJO Weekly Chart.  


XJO down this week, -2.13%, erasing the gain from the previous week. 

XJO had no trouble slicing through important support at 6957 and finished at the equally important support of 6900 (round figures).

XJO Daily Chart.


XJO held up reasonably well for the first three days of the week, but sliced through important support t 7000 (round numbers) on Thursday.  On Friday, it continued down through the next support at 6957 to finish at the next important support of 6900.

Positive divergence on the MACD Histogram suggests the next move will be to the upside.

SP500 Daily


SP500 is showing a similar pattern to the XJO.   It is back down to an important support zone.   It is also opposite a high volume node which might provide support.  

MACD shows a positive divergence which suggests the next move will be to the upside.

SP500 was down -2.39% for the week.  That was an unusual negative result as the past week was Options Expiry Week which has a positive bias.


Sector Performances this week.

The only places to be this week were XEJ (Energy) +2.67% and XGD (Gold Miners) +6.1%.    Both were benefitting from a War premium due to the Hamas/Isreal Clash.


After Energy,  best performing sector (relatively) was Materials (XMJ) down -1.57%,  IT (Info. Tech) was down a whopping -5.07%.  IT over the long term has a good growth record, but short term can be volatile.  A great trading mechanism for savvy traders (as is Energy and Gold).

From the time of the initial incursion by Hamas into Israel early in October, XGD (Gold Miners) is up more than +15%.


100 Leader Stocks above their 200-Day, 50-Day and 10-Day Moving Averages.

  • Above their 200-DMA:  last week 35%, this week 32%.
  • Above their 50-DMA:  last week 32%, this week 21%
  • Above their 10-DMA:  last week 72%, this week 19%.
The few times we've seen figures like those for ^10DMA were in early July '23, mid March '23 and late Sept. '22.

I've marked those times on a weekly chart of XJO below:

 The last three times we had an exceptionally low reading for Stocks ^10DMA. it has been followed by a tradable rally.

Conclusion.
 
The War in the Middle East has had a negative effect on stock markets, but Energy and Gold Miners have been beneficiaries.
 
Technical analysis suggests the next movement in stocks will be to the upside, but we're in a dangerous period with War in the Middle East.  So technical analysis might be thrown out the window.
 
November tends to be a positive month for stocks.
 
Finally, SPY (ETF for SP500) finished at  $420.58.  MAX PAIN for November Options Expiry for SPY is $450.  That's a hefty premium of +7%.
 
Good luck


Friday, October 20, 2023

21/10/23. Saturday Finspiration Report.

 Yesterday, ASX fell heavily again.

XJO down -1.16% yesterday.  It is now back down to the key horizontal support level of 6900.  If that fails, the next major horizontal support level is 6440. That would entail a further drop of about -6.5%.  From late July till now, XJO is down about -7.5%.

Between now the next major horizontal support level is the 200-Week MA at 6770, that could also provide a significant support level.  

Below is a weekly chart showing the next support levels.

Will the Index continue falling?  Possible.  

On the positive side, daily chart indicators are beginning to show upside potential.  Daily RSI is at 35.9 which is oversold (but not very oversold).  Indicators in the lower panels, show potential for positive divergences - but we have to wait and see how those play out.

Overnight.

U.S. Stock indices were weak.  Oil down and gold showed intra-day selling.

SP500 is down to horizontal support and close to its 200-Day MA.  That's dual support which may hold.

Like the XJO, SP500 is oversold with an RSI at 35.4 - almost line ball with the XJO RSI at 35.9.  So SP500 is not very oversold.

A big potential positive divergence exists on the MACD which could suggest a move to the upside.

Volume is rising but not enough to suggest yet that we are seeing a wash-out.

Force Index is falling to a low level - but, again, not enough to suggest a wash-out.

Indications from the chart is that a near-term double bottom low could be forming - but we need to see more information to fell sure about that. 

Commodities.

Commodities Index -0.75%.  Energy -0.65%.  Base Metals -0.28%.  Agriculture -0.23%.  Gold +0.27%.

Commodities may provide a better understanding of what might happen to stocks.  Commodities are traded by people - professional traders who often predict the future course of events than stocks.

Volumes for Energy have risen sharply in the past two days which suggest a looming down-turn.  Last night's candle on Gold is a big "shooting-star" coming at the top of the up-trend on high volume suggests the end of the spike in Gold.

Gold.


 Gold is a "safe-haven" in times of geo-political unrest as we've seen in the current turmoil in the Middle East.  Since 6 October, the time of Hamas incursions into Israel, Gold has risen nearly +9%.  Friday's intra-day selling may point to the end of the rise.  

Negative divergence on the 3-Day EMA of the Force Index suggests the next movement will be to the downside.   That would indicate optimism that the current geo-political turmoil is coming to an end.

Good luck.


Thursday, October 19, 2023

20/10/23. Friday Morning Finspiration Report.

Stocks down, Energy up, Gold up.

 Fed Head Powell speech last night produced nothing new in the way of monetary policy but the stock market reacted in a volatile manner, down, then up, then down, down down.

The market was relatively docile before he spoke but after effects were negative.


Dow Jones -0.75%.  SP500 -0.85%.  Nasdaq -0.96%.  Small Caps -1.55%.  Banks -1.33%.

SP500.

Sp500 seems destined to retest the 200-Day MA.  If that fails, we may be looking at a bear market correction.  But let's cross that bridge if it happens.

Commodities.


Commodities Index.  +1.04%.  Energy +1.35%.  Base Metals +0.11%.  Agriculture +0.23%.  Gold +1.23%.

The Australian market is well down this morning - more than -1%.  Energy is the only sector on the positive side.


Finspiration Australia. 14/11/23. Tues. Morning Report.

Mixed Results in New York.  Energy up. NAB ex-dividend today. Dow Jones +0.16%.  SP500 -0.08%.  Nasdaq -0.11%.  Small Caps -0.07%.  Banks -0...