Saturday, August 5, 2023

 
This is heavy duty analysis this week.  Try to stay with it to the end.


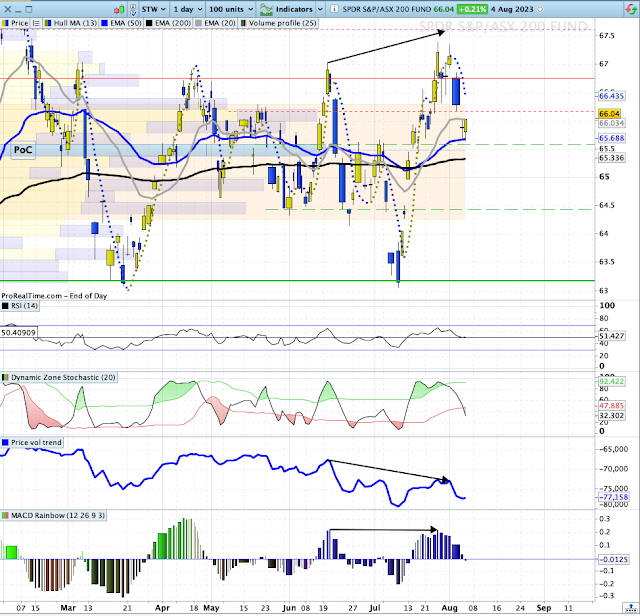
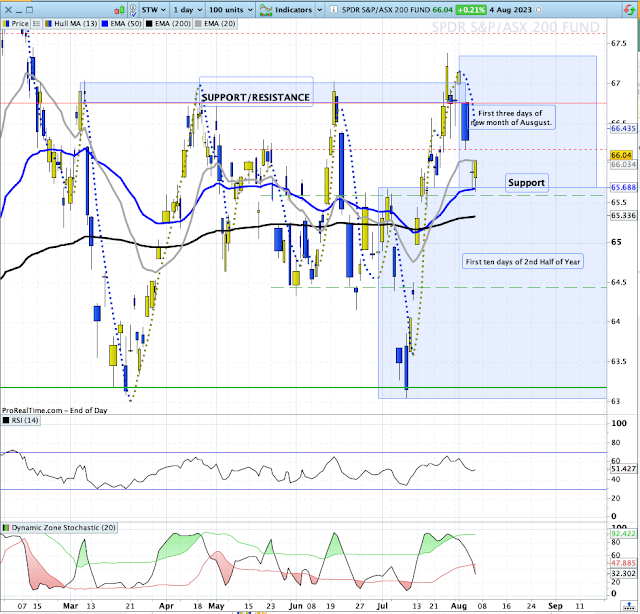
STW Daily Chart.  (STW is a tracking ETF for the XJO)


(
The above chart is a Candle/Volume chart.  The volume is indicated by the width of the candle.  This allows a viewer to see the relative volumes entering the market.  The height of a Candle/Volume is the same as a normal candle.)

On 27 July, STW broke above the old Support/Resistance zone which had played a part in the XJO for a few months.  That upside break proved to be a false break and the Index fell back through the zone on heavy volume on 2 August.

Various theories exist relating to range trading: 

1.  If the range of the first 10-Days trading of the new half-year, is exceeded - then that should provide direction for much of the half year.

2.  If the range of the first three days trading of a new month is exceeded - that then should provide direction for the first half of the new month.

 I've marked these two ranges on the chart.

 The top of the 10-day range occurred on 4 July.  The Index broke upwards from the 10-Day range on 14 July and then broke above support resistance.

The first three days of August fit exactly above the first ten days of the second half of the year.  So there was a break-out from the 10-Day range.

On Thursday, 3 August came back down to test the top of the 10-Day range for the new half year.  It then bounced to the upside on Friday.

The 10-Day range remains intact and the break-out from this range remains intact.

A fall back into the 10-Day range is likely to see a test of the low of the 10-Day range which occurred on 10 July.  

The high of the 10-Day range and the low of the three-day range also coincide (more or less) with the 50-Day MA.  So that level is clearly important for the market.

The market is at an inflection point.

Daily STW with more Volume information.


This chart adds more weight to the idea that the STW is at an inflection point.  That level coincides with the "Point of Control" (PoC) shown in the Volume Profile on the left of the chart.  Point of Control is the level on the chart where the most volume has traded.  PoC tends to act as a magnet for the chart and that's more or less where the chart landed this week then bounced.

So we have a number of important levels in confluence.  

1.  Top of the 2nd Half 10-Day range.

2.  Bottom of the new month 3-Day range

3.  Horizontal resistance.

4  Volume Profile's Point of Control.

The pull-back in the 3-Day range at the beginning of August was well signalled by negative divergences on the Price Volume Trend and the MACD Histogram.  Unless there is a sudden improvement in the market at the beginning of the coming week, we can expect more downside as the confluence of supports gets broken.

Sector Performances this week.


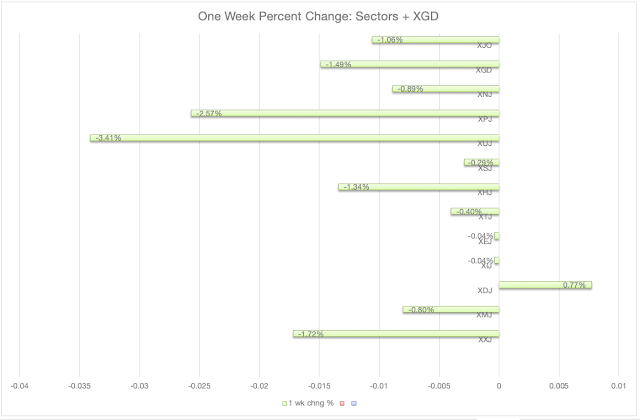
XJO was down -1.06% this week and ten out of eleven sectors were down.

The only positive sector was Discretionary +0.77%.  The next two best performers (relatively) were Information Technology and Energy, both down marginally -0.04%.  That's interesting as those three sectors are all Cyclicals.  We expect Cyclicals to perform poorly in a falling market and Defensives (Health, Utilities and Staples) to perform best.  What's going on?  Beats me.

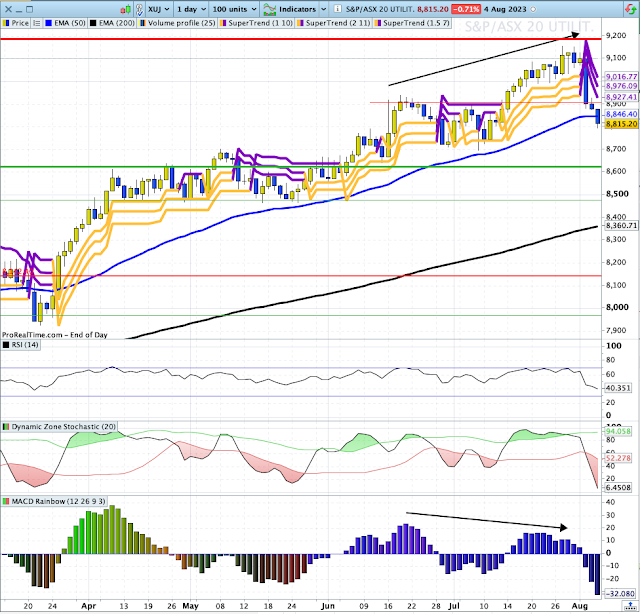
XUJ is particularly interesting as it has been one of the best performing sectors in recent months, but its run-up looks like it has finished.

XUJ is on a triple Super-trend sell signal and is below its 50-Day MA for the first time since 27 March.  Now it is oversold on Stochastic at 6.45 so it might bounce here - and prove me wrong.

52-Day Relative Strength of Sectors.

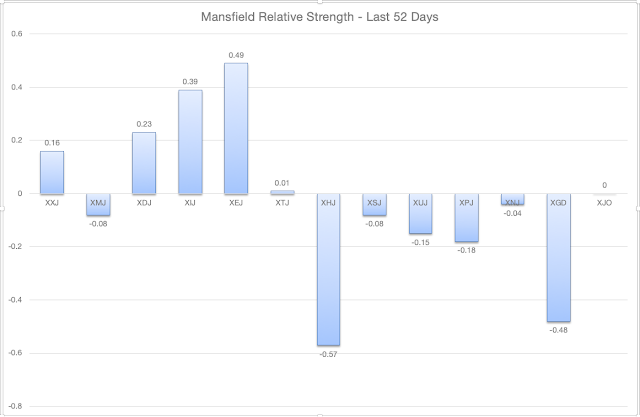
Mansfield Relative Strength measures the performance of an item against the performance, in this case, of the XJO over the past 52 Days.

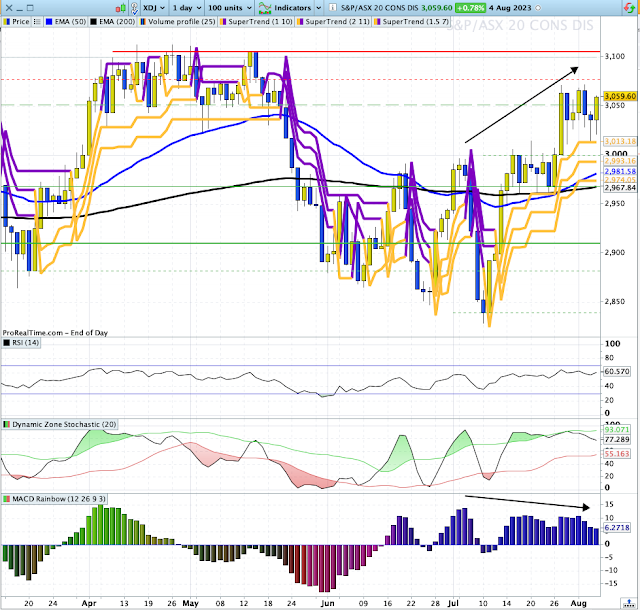
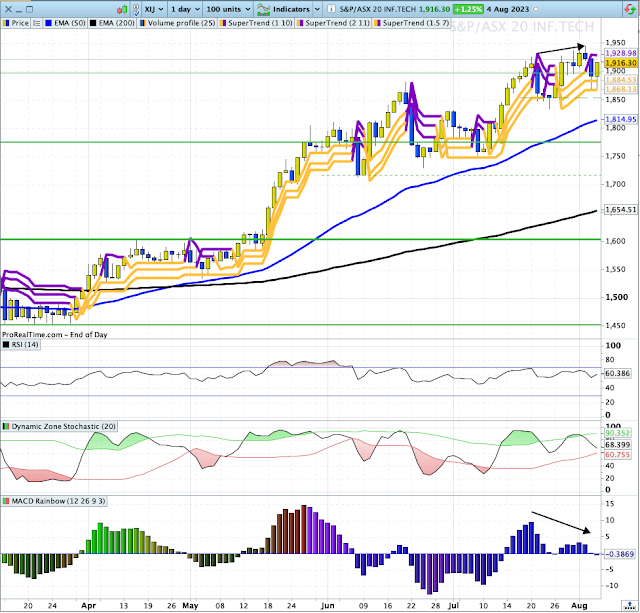
Interestingly, the three best performers over the past 52 days were also the best performers over the past week:  XDJ, XEJ and XIJ.


The negative divergence on the MACD Histogram and the chart doesn't bode well for the near future of XDJ.

XIJ is showing a negative divergence on MACD Histogram (and RSI and Stochastic).  So the outlook for XIJ is not looking strong.

Conclusion.

That's all from me this week.  I'm not feeling confident about the near future of our market.

It is at an inflection point, but the weight of evidence suggests a fall into the 10-Day Range at the beginning of the 2nd Half of the Year.  Not a good prognostication.


Friday, August 4, 2023

5/8/23. Saturday Finspiration Report.

 Friday:  XJO up, Europe down, U.S. down, Energy up.

XJO


XJO is in a short-term down trend consolidating at its lows after forming a short-term bearish top.

It finished a little above a horizontal support level.

Using the Ichimoku system, XJO has fallen below its Conversion Line but remains above its Base Line.

Longer term, XJO remains bullish as it sits well above the Kumo Cloud.

The possibility of a Head/n/Shoulders top remains.  A break below support would complete a H/n/S Top.

Continue to monitor.

SP500


Last night's candle is a bearish engulfing candle which suggests mor down-side.

The chart is at the lower edge of the Standard Error Channel and marginally below the Base Line of the Ichimoku system.  That suggests we may see a rubber-band reversal to the upside.

Longer term, the chart is well above its Kumo Cloud (bullish) and DMI (200) remains bullish.

Look for a reversal to the upside in the near future.

Energy.


Energy has had a great run since it broke above the Kumo Cloud in early July.

That run may be coming to an end with a negative divergence on the MACD.  RSI is well overbought (above 70).

Volume studies suggest that "Smart Money" may be pulling out of this market.  A pull-back to the 200-Day MA seems likely.  That would still keep it in bullish territory above the Kumo Cloud.  

A chance to get back into this bullish market on the pull-back?

Thursday, August 3, 2023

4/8/23. Friday Morning Finspiration Report.

 Europe down.  U.S. down modestly.  Oz Futures down a little -0.1%.

Overnight in the U.S.:


Dow Jones -0.19%.  SP500 -0.25%.  Nasdaq -0.19%.  Small Caps -0.37%.  Banks +0.67%.  Banks bounced off the 20-Day MA - a positive move.

SP500.


SP500 stabilised at the Base Line of the Ichimoku system, but below the Conversion Line.  I'd expect to see an up move here to test the Conversion Line.  All bets are off until we see a move back above the Conversion Line.

Commodities.


Commodities Index +0.95%,  Energy +1.46%.  Base Metals +0.81%.  Agriculture -0.78%.  Gold -0.03%.

With Energy, Base Metals and Banks higher, we could see a surprise upside move in the XJO today.

3/8/23. Thursday Evening Finspiration Report.

 ASX well down today but intra-day buying knocked off some of the fall.  XJO -0.59%


XJO is now down close to horizontal support, we might get a rebound here or some consolidation.

After two days down, the Index has formed a double top but in the medium term the trend remains to the upside.

Ten of eleven sectors were negative today, with Telecoms the only positive +0.19%.  Staples only just landed in the red -0.01%.  Discretionary was third best -0.19%.  XDJ is a cyclical sector so that's a promising sign.  It showed distinct signs of intra-day buying.


Worst today was the highly volatile Information Technology (following the Nasdaq down). XDJ -1.63%.

In early European trading, stocks are down heavily following Australia.  DAX -0.8% and UK FTSE -1.29%.

I'm looking for a rebound in the American market tonight to throw off the wobblies caused by the Fitch down-grade.

Wednesday, August 2, 2023

3/7/23. Thursday Morning Finspiration Report.

 Yesterday, XJO was down heavily -1.29%.  All eleven sectors were negative.

SFE Futures are well down this morning after big falls in Europe and the U.S.  Oz Futures -0.79%.

Overnight in the U.S.


Dow Jones -0.98%.  SP500 -1.38%.  Nasdaq -2.17%.  Small Caps -0.88%.  Banks -1.1%.

Nasdaq has formed a double top and broken below its 20-Day MA.


The break down by Nasdaq below support is only marginal so it may not signal more down side.

The Index is on a triple Super-trend sell signal.  If more down side does come (likely), then the Support Zone shown on the chart is centred on a High Volume Node and at the 50-Day MA.  So that will likely hold.

Commodities.


Commodities Index -1.51%.  Energy -1.5%.  Base Metals in free fall -1.74%.  Agriculture -0.77%.  Gold -0.48%.

Down grade by Fitch of the U.S. resulted in the $U.S. rising.  That had a negative impact on commodities.  Not good for Australian resource stocks.

Tuesday, August 1, 2023

2/8/23. Wednesday Morning Finspiration Report.

Dow Jones continues to defy gravity, now up 16 of the past 17 days, but SP500 falls.

Sydney Futures -0.53% suggest the Ozzie market might be a bit soft today.

Dow +0.2%.  SP500 -0.27%.  Nasdaq -0.25%.  Small Caps -0.49%.  Banks -0.99%.


 SP500


SP500 is consolidating in a tight range.  Negative divergences on MACD histogram suggest the Index is headed lower.

Commodities.

Commodities Index -0.53%.  Energy -0.07%.  Base Metals -1.51%.  Agriculture +0.14%.  Gold -1.04%.

Gold remains in a short-term down-trend.

BHP overnight in the U.S. down -2.71%.  Rio -1.47%.  Woodside -1.86%.

The big news after hours is the downgrade by Fitch of the American rating to AA+ from AAA.

According to CNBC:  “In Fitch’s view, there has been a steady deterioration in standards of governance over the last 20 years, including on fiscal and debt matters, notwithstanding the June bipartisan agreement to suspend the debt limit until January 2025,”

Dow Futures are down -0.22%.


1/8/23. Tuesday Evening Finspiration Report.

In early trading, European stocks have opened lower.  STOXX600 down -0.35%.  American Futures are also down.  Dow Fut -0.22%.

In Australia today, RBA left interest rates on hold.  ASX jerked higher on the news then gave back a chunk with the XJO finishing up +0.54%.


XJO remains in a bullish up-trend.  Stay with the trend until clear weakness is seen in the chart.

 All sectors were up today, with the best being Information Technology (XIJ), up +1.14%.

Gold Miners (XGD) was up +1.89%.

Here's the XGD chart;

Despite today's good result, the shor-term trend is bearish.  Today's candle finished at dual resistance - horizontal and the 50-Day MA.  XGD needs to rise above both of those and over come the resistance of triple Supertrend lines.  It might make hard work of that.

At this stage of proceedings it seems likely that the XJO will remain in consolidation mode tomorrow.  Sydney Futures are currently down -0.12%.


Finspiration Australia. 14/11/23. Tues. Morning Report.

Mixed Results in New York.  Energy up. NAB ex-dividend today. Dow Jones +0.16%.  SP500 -0.08%.  Nasdaq -0.11%.  Small Caps -0.07%.  Banks -0...