Thursday, July 6, 2023

7/7/23. Friday Morning Finspiration Report.

 Overnight in the U.S.


Dow Jones -1.07%.  SP500 -0.79%,  Nasdaq -0.82%.  Mid Caps -1.07%.  Small Caps -1.46%.  Banks -1.57%.

SP500.


SP500 opened with a big gap down following big down-side moves in Europe and the East on Thursday.

Plenty of intra-day buying limited the degree of the fall.

Gaps on the 20 June and 30 June have now been closed.  The gap above Thursday's candle remains open.  Gap Theory says that all gaps must close (eventually).

Despite the big movement last night, the SPX remains in an up-trend - above the 20-Day MA which is still heading up.  MH40 remains up and the single Supertrend Line I have on the chart remains up.

Supertrend and 20-Day MA could provide support.  

Commodities.


Commodities Index -0.22%.  Energy -0.18%.  Base Metals -0.11%.  Agriculture -0.09%.  Gold -0.3%.

Last night's candle on Energy shows an exceptionally long lower wick - evidence of lots of intra-day buying.  Watch for a break above horizontal resistance which is not too far over-head.  Such a break should see a big move to the upside.

Gold is showing a strong positive divergence on its CCI - it could also be setting up for a big upside move after its long bearish fall.

After 40 minutes in Australia, XJO is down -1.65% but off its lows.  This could erase more of the big opening move to the downside.

All eleven sectors are negative with Energy down 2.15% (worst).  Watch for a move up from here in XEJ.

6/7/23. Thursday Evening Finspiration Report.

 Kaboom!  XJO fell heavily today -1.24%.

That sends most indicators into bearish territory.

Ten sectors were down today and only one up - XIJ (Information Technology).  Don't get too excited - it was only up +0.13%.  Better than a poke in the eye.
Worst was Consumer Discretionary XDJ -1.91% followed closely by Materials XMJ -1.86%.  

Europe, in early trade, has followed Australia to the downside STOXX600 down more than -1%.

U.S. Futures are weak with Dow Futures down -0.41%.


Wednesday, July 5, 2023

6/7/23. Thursday Morning Finspiration Report.

 Yesterday In Australia.


Yesterday, XJO stalled at horizontal resistance.  Today it has continued its downside move and is currently down -0.7%.  Things are crook in Tullaroop.

Overnight in the U.S.


Major indices have stalled at recent highs.

Dow Jones -0.38%.  SP500 -0.2%.  Nasdaq -0.18%.  Mid Caps -0.89%.  Small Caps -1.5%.  Banks -0.89%.

SP500

SP500 was down a little last night but remains in a strong up-trend.  

We'll to wait and see if this stall at horizontal resistance is the start of something bigger, or just a pause before rising above resistance.  Money Flow Index (not shown on the chart) has a negative divergence to the SP500, so the odds lie to the down-side.  The poor performance of the XJO this morning is also an indication of further downside.  (XJO often pre-empts moves in the U.S., despite the pundits always telling us that Oz follows the lead of the U.S.)

Commodities.


Commodities Index, +0.62%.  Energy +1.65%.  Base Metals -0.83%.  Agriculture -0.33%.  Gold -0.35%.

Energy is knocking on horizontal resistance for the fourth time in the few weeks.  XEJ shows plenty of intra-day buying on heavy volume so it might break through to the upside soon.


Tuesday, July 4, 2023

4/7/23. Tuesday Evening Finspiration Report.

 XJO was just negative at 2.30 p.m. when the RBA announced its interest rate decision.  The didn't move it one iota - or even a basis point.  I would have thought that would send the XJO into the stratosphere.  There was a lot of cheering from the front stalls, but. .....  XJO only finished up +0.45%.  A bit dreary really - like the weather in Brisbane today.

Anyhow, here's the XJO chart:


Still, I shouldn't complain.  The short-term trend is up and XJO has been up five out of six days.  The one day it was down - it was down only -0.02%.

Now the index is at horizontal resistance.  Given that America is closed for Fireworks (and the multiple wild fires which will start as a result) you can bet your bottom dollar that our market will fall back a bit tomorrow.

I'd suggest you go to the beach - except that would be a very silly idea.   Tomorrow's weather will be like today's - horrible.  Anyone for tiddlywinks or monopoly?

See you tomorrow.

Oh, by the way, NewHighs-NewLows Cumulative has turned bullish.  There's a sunny thought for you.


Monday, July 3, 2023

4/7/23. Tuesday Morning Finspiration Report.

 Overnight in the U.S. the stock market was sluggish with low volume ahead of the 4th July Holiday.


Dow Jones +0.03%.  SP500 +0.12%.  Nasdaq +0.21%.  Mid Caps +0.21%.  Small Caps +0.62%.  Banks +1.76%.

SP500.


SP500 has taken a pause while many traders are absent ahead of Fourth of July Holiday.

The index remains bullish with triple Supertrends all yellow.

The High Volume Node shown on the chart could provide support in the event of a pull-back.

Commodities.


Commodities Index flat +0.00%.  Energy -0.76%.  Base Metals +0.22%.  Agriculture +1.14%.  Gold +0.11%.

After 15 minutes of trading this morning, XJO is relatively flat,+0.12% waiting on the RBA decision later today.


3/7/23. Monday Evening Finspiration Report.

 XJO rose today +0.59%.  It broke above horizontal resistance and the 20-Day MA.  That's a show of confidence given that the RBA will announce ints interest rate decision tomorrow.


Materials (XMJ) was the best performing sector today, up +1.08%, just nudging ahead of Utilities (XUJ) up +1.05%.

My favoured sector XIJ was down today -1.45%.  That suggests that the big punters think we'll see an interest rate rise tomorrow.  Stocks in Info,Tech. tend to be heavily leveraged and unduly impacted by interest rate rises.  We'll have to see tomorrow.


Today's candle was a bearish engulfing candle but the Index remains in a medium term up-trend.  We need to see more evidence before thinking that the up-trend in XIJ is over.

Saturday, July 1, 2023

2/7/23. Weekly Finspiration Report.


Yep, it's that time of the month again.  Punters sit glued to the screen waiting for the monthly Interest Rate Decision from the RBA.   Then the pundits will parse every word coming from the mouth of the Big Boss of the RBA - Phil Lowe.  Good luck to mortgage holders.


XJO Daily Chart.


XJO up this week,  +1.47%.  But technicals are indecisive.

The chart sits in the Kumo Cloud - the non-trade zone.

Conversion Line and Base Line are sitting together - If the chart goes up - Conversion Line rises above the Base Line - a probable buy signal.

If Chart goes down - Conversion Line falls below the Base Line - a probable sell signal.

Looks like the RBA is holding the stock market in its hands.  Amazing how this happens ahead of critical announcements.

American SP500.


The American chart looks nothing like the Australian chart.  They've decoupled.  

SP500 is in a strong up-trend.

SP500 tells us little about the prospects for the Ozzie market.


Sector Performance this past week.

This Week's Sector Performance Chart tells a story.  

On the right-hand side of the chart I've grouped the Defensives.  XHJ (Health), XSJ (Staples) and XUJ (Utilities) - all are negative.

The stand-out is XIJ (Info.Tech) up 4.52%.

On the left-hand side are the cyclicals.  XXJ (Financials), XMJ (Materials), XDJ (Discretionary) and XPJ (Property)

Although XIJ is the stand-out, on balance, there's been a shift out of Defensives into Cyclicals.  That's bullish for the stock market.

Of course, that's only a short-term snap-shot.  That can quickly change.

Change over the Medium Term and Long Term.

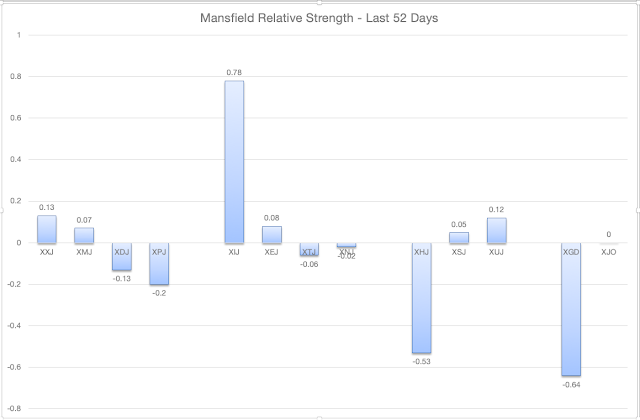
For longer term views I turn to the 52-Day and 52-Week Mansfield Relative Strength Indices.

52-Day Mansfield.


52-Week Mansfield
No matter how you cut and dice it, XIJ in the short, medium and long-term has been the place to be.  And the place to avoid - XHJ.

NewHighs-NewLows Cumulative.


This chart trends fairly strongly.  Since the beginning of the year it has had four clear moves, up, down, up, down.  The down moves have been longer lasting than the up moves.

NH-NL CUM has kicked up above its 10-week MA.  That might suggest a start to a new up move.

That might depend on reaction to the RBA's Interest Rate Decision.

Next week should be interesting.

July tends to be a positive month.

I'm tending to the bullish side at this stage but - like the RBA - I'll be driven by the data.


Finspiration Australia. 14/11/23. Tues. Morning Report.

Mixed Results in New York.  Energy up. NAB ex-dividend today. Dow Jones +0.16%.  SP500 -0.08%.  Nasdaq -0.11%.  Small Caps -0.07%.  Banks -0...