Monday, July 3, 2023

3/7/23. Monday Evening Finspiration Report.

 XJO rose today +0.59%.  It broke above horizontal resistance and the 20-Day MA.  That's a show of confidence given that the RBA will announce ints interest rate decision tomorrow.


Materials (XMJ) was the best performing sector today, up +1.08%, just nudging ahead of Utilities (XUJ) up +1.05%.

My favoured sector XIJ was down today -1.45%.  That suggests that the big punters think we'll see an interest rate rise tomorrow.  Stocks in Info,Tech. tend to be heavily leveraged and unduly impacted by interest rate rises.  We'll have to see tomorrow.


Today's candle was a bearish engulfing candle but the Index remains in a medium term up-trend.  We need to see more evidence before thinking that the up-trend in XIJ is over.

Saturday, July 1, 2023

2/7/23. Weekly Finspiration Report.


Yep, it's that time of the month again.  Punters sit glued to the screen waiting for the monthly Interest Rate Decision from the RBA.   Then the pundits will parse every word coming from the mouth of the Big Boss of the RBA - Phil Lowe.  Good luck to mortgage holders.


XJO Daily Chart.


XJO up this week,  +1.47%.  But technicals are indecisive.

The chart sits in the Kumo Cloud - the non-trade zone.

Conversion Line and Base Line are sitting together - If the chart goes up - Conversion Line rises above the Base Line - a probable buy signal.

If Chart goes down - Conversion Line falls below the Base Line - a probable sell signal.

Looks like the RBA is holding the stock market in its hands.  Amazing how this happens ahead of critical announcements.

American SP500.


The American chart looks nothing like the Australian chart.  They've decoupled.  

SP500 is in a strong up-trend.

SP500 tells us little about the prospects for the Ozzie market.


Sector Performance this past week.

This Week's Sector Performance Chart tells a story.  

On the right-hand side of the chart I've grouped the Defensives.  XHJ (Health), XSJ (Staples) and XUJ (Utilities) - all are negative.

The stand-out is XIJ (Info.Tech) up 4.52%.

On the left-hand side are the cyclicals.  XXJ (Financials), XMJ (Materials), XDJ (Discretionary) and XPJ (Property)

Although XIJ is the stand-out, on balance, there's been a shift out of Defensives into Cyclicals.  That's bullish for the stock market.

Of course, that's only a short-term snap-shot.  That can quickly change.

Change over the Medium Term and Long Term.

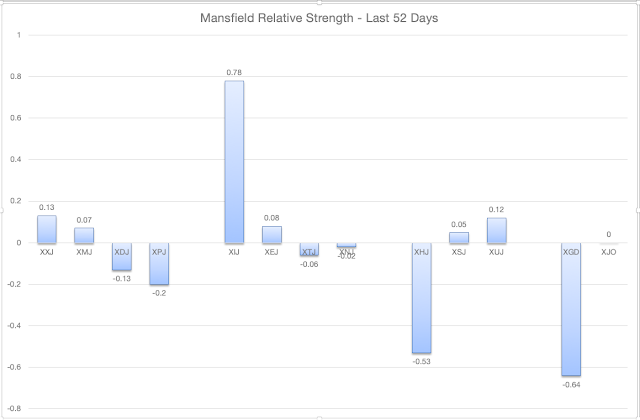
For longer term views I turn to the 52-Day and 52-Week Mansfield Relative Strength Indices.

52-Day Mansfield.


52-Week Mansfield
No matter how you cut and dice it, XIJ in the short, medium and long-term has been the place to be.  And the place to avoid - XHJ.

NewHighs-NewLows Cumulative.


This chart trends fairly strongly.  Since the beginning of the year it has had four clear moves, up, down, up, down.  The down moves have been longer lasting than the up moves.

NH-NL CUM has kicked up above its 10-week MA.  That might suggest a start to a new up move.

That might depend on reaction to the RBA's Interest Rate Decision.

Next week should be interesting.

July tends to be a positive month.

I'm tending to the bullish side at this stage but - like the RBA - I'll be driven by the data.


Friday, June 30, 2023

1/7/23. Saturday Finspiration Report.

Friday:  Australia flat.  Europe up.  America up.  Commodities up.

XJO.


XJO up marginally on Friday +0.12%.  We've had two days of doji candlesticks - the market basically going nowhere.

The chart is stuck in the middle of the Bollinger Bands and the Kumo Cloud, i.e., non-trending.

Overhead resistance is provided by the 50 Day MA and the Base Line and Conversion Line of the Ichimoku are sitting together, i.e., non-trending.

That seems likely to change for the first trading day of the second half of 2023 as U.S. finished up strongly.

U.S.

Dow Jones +0.84%.  SP500 +1.23%.  Nasdaq +1.45%.  Mid Caps +0.65%.  Small Caps +0.12%.  Banks 0.22%.

The three major indices (DJ, SPX, NDX) all started the session emphatically - gap up and kept going.

This could be a case of window dressing on the part of fund managers.  The three indices are now testing recent highs.  Watch for a fall back on Monday.

SP500.

SP500 is in an uptrend, sitting just above horizontal support.

Indicators are all bullish, but RSI14 is nudging on overbought with a reading of 69.2.  

Stay with the trend until otherwise indicated.

Commodities.

Commodities Index +0.84%.  Energy +1.16%.  Base Metals +1.07%.  Agriculture +0.87%.  Gold +0.67%,

Overnight in the U.S., BHP up marginally, +0.17%, Rio +0.06%, Woodside +0.5%.

Those Ozzie stocks trading in the U.S. are nothing to cheer about.

Sydney ASX Futures - up 0.4% - promises a positive start on Monday morning.


Thursday, June 29, 2023

30/6/23. Friday Morning Finspiration Report.

 Overnight in the U.S.  Dow Up.  Nasdaq flat.  Energy up.  Base Metals down.


Dow Jones +0.8%.  SP500 +0.45%.  Nasdaq -0.00%.  Mid Caps +1.19%.  Small Caps +1.65%.  Banks +1.82%.

SP500.


SP500 is in a short-term up trend.  

With one Supertrend yellow and two blue - doubts remain about the longer term trend.  Watch for a new higher high to confirm the longer term up trend.

Commodities. 

Commodities Index flat +0.04%.  Energy +0.8%.  Base Metals -0.65%.  Agriculture -0.57%.  Gold -0.11%.  Gold is very oversold but showed intra-day buying today.  That suggests that the longterm downtrend may be ending.  Continue to watch.

After 50 minutes of trading this morning, XJO is down -0.4%.  

ASX has a very large number of ETFs going ex-dividend today - that is having an impact on the broad market as well as the technical hurdles I mentioned last night.

29/6/23. Thursday Evening Finspiration Report.

 After being up early in trading, XJO fell intraday to finish flat -0.02%.

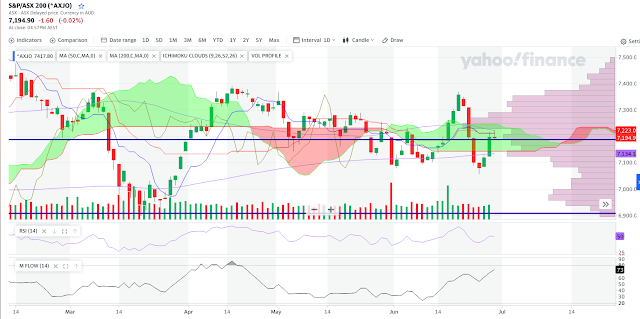
Today the XJO hit resistance of the Base Line of the Ichimoku system and pulled back.

That also coincided with the Line of Control - the longest bar of the Volume Profile on the right of the chart.  The Line of Control is the region where the most volume has occurred for the XJO during the past six months.  That often acts as support/resistance.

So, on the basis of probabilities, the next movement for the XJO will be to the downside.  

Best performing sector today, by a long shot, was Info.Tech. (XIJ) up +1.81%.  Next best was XXJ (Financials) +0.53%.  Acting as a counter-weight to the rise in XXJ was XMJ (Materials) down -0.75%.

(Today, I've used a chart from Yahoo Finance - it is one of the few charting services which provide volume data for the XJO - although not for the current day.  What is it about the ASX that volume data for indices is so hard to access?  Beats me.  Volume is an essential tool for technical analysis - yet the ASX denies its use by retail investors.)


Wednesday, June 28, 2023

29/6/23. Thursday Morning Finspiration Report.

 Overnight in the U.S.  Mixed results in Equities.  Energy up, Base Metals down.


Dow Jones -0.22%.  SP500 -0.04%.  Nasdaq +0.27%.  Mid Caps =0.01%.  Small Caps +0.11%.  Banks -0.41%.

SP500.


SP500 was flat last night.  Tuesday's action was promising but we need to see more upside than we saw last night to confirm a return to the bullish rally.  Watch.

Commodities.


Commodities Index -0.31%.  Energy +1.12%.  Base Metals -0.83%.  Agriculture -1.13%.  Gold -0.23%.

After 50 minutes of trading, XJO is up +0.2%.  Banks are up, miners are down.

28/6/23. Wednesday Evening Finspiration Report.

 XJO up strongly today, +1.1%.


The ASX is still bonkers.  Daily move for the past two weeks have been very strong.

I shouldn't complain while the market is going up - but when it comes down - it comes with a big thud.

Daily RSI is higher than Weekly RSI so the market is in a counter-trend rally.  So far so good.

Ten out of eleven sectors were up today - but the strongest were a pleasant surprise.  Best was Discretionary +2.14%.  Does that mean the interest rate hikes are coming to an end?  Too soon to say, But Property was also up strongly +2.05%.  There seems to be a pattern forming.

Let's see what tomorrow brings.


Finspiration Australia. 14/11/23. Tues. Morning Report.

Mixed Results in New York.  Energy up. NAB ex-dividend today. Dow Jones +0.16%.  SP500 -0.08%.  Nasdaq -0.11%.  Small Caps -0.07%.  Banks -0...