Thursday, June 29, 2023

30/6/23. Friday Morning Finspiration Report.

 Overnight in the U.S.  Dow Up.  Nasdaq flat.  Energy up.  Base Metals down.


Dow Jones +0.8%.  SP500 +0.45%.  Nasdaq -0.00%.  Mid Caps +1.19%.  Small Caps +1.65%.  Banks +1.82%.

SP500.


SP500 is in a short-term up trend.  

With one Supertrend yellow and two blue - doubts remain about the longer term trend.  Watch for a new higher high to confirm the longer term up trend.

Commodities. 

Commodities Index flat +0.04%.  Energy +0.8%.  Base Metals -0.65%.  Agriculture -0.57%.  Gold -0.11%.  Gold is very oversold but showed intra-day buying today.  That suggests that the longterm downtrend may be ending.  Continue to watch.

After 50 minutes of trading this morning, XJO is down -0.4%.  

ASX has a very large number of ETFs going ex-dividend today - that is having an impact on the broad market as well as the technical hurdles I mentioned last night.

29/6/23. Thursday Evening Finspiration Report.

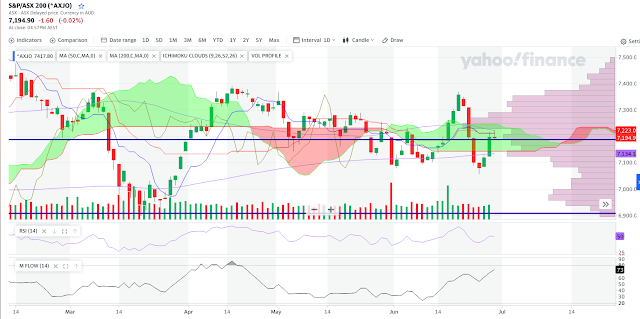
 After being up early in trading, XJO fell intraday to finish flat -0.02%.

Today the XJO hit resistance of the Base Line of the Ichimoku system and pulled back.

That also coincided with the Line of Control - the longest bar of the Volume Profile on the right of the chart.  The Line of Control is the region where the most volume has occurred for the XJO during the past six months.  That often acts as support/resistance.

So, on the basis of probabilities, the next movement for the XJO will be to the downside.  

Best performing sector today, by a long shot, was Info.Tech. (XIJ) up +1.81%.  Next best was XXJ (Financials) +0.53%.  Acting as a counter-weight to the rise in XXJ was XMJ (Materials) down -0.75%.

(Today, I've used a chart from Yahoo Finance - it is one of the few charting services which provide volume data for the XJO - although not for the current day.  What is it about the ASX that volume data for indices is so hard to access?  Beats me.  Volume is an essential tool for technical analysis - yet the ASX denies its use by retail investors.)


Wednesday, June 28, 2023

29/6/23. Thursday Morning Finspiration Report.

 Overnight in the U.S.  Mixed results in Equities.  Energy up, Base Metals down.


Dow Jones -0.22%.  SP500 -0.04%.  Nasdaq +0.27%.  Mid Caps =0.01%.  Small Caps +0.11%.  Banks -0.41%.

SP500.


SP500 was flat last night.  Tuesday's action was promising but we need to see more upside than we saw last night to confirm a return to the bullish rally.  Watch.

Commodities.


Commodities Index -0.31%.  Energy +1.12%.  Base Metals -0.83%.  Agriculture -1.13%.  Gold -0.23%.

After 50 minutes of trading, XJO is up +0.2%.  Banks are up, miners are down.

28/6/23. Wednesday Evening Finspiration Report.

 XJO up strongly today, +1.1%.


The ASX is still bonkers.  Daily move for the past two weeks have been very strong.

I shouldn't complain while the market is going up - but when it comes down - it comes with a big thud.

Daily RSI is higher than Weekly RSI so the market is in a counter-trend rally.  So far so good.

Ten out of eleven sectors were up today - but the strongest were a pleasant surprise.  Best was Discretionary +2.14%.  Does that mean the interest rate hikes are coming to an end?  Too soon to say, But Property was also up strongly +2.05%.  There seems to be a pattern forming.

Let's see what tomorrow brings.


Tuesday, June 27, 2023

28/6/23. Wednesday Morning Finspiration Report.

 Overnight:  U.S market up, Energy down, Base Metals up.


Dow Jones +0.63%.  SP500 +1.15%.  Nasdaq +1.54%.  Mid Caps +1.61%.  Small Caps +1.75%.  Banks +1.07%.

SP500.


SP500 bounced strongly off the 20-Day MA and back above the 8-Day EMA.  Expect more upside.

Commodities.

Commodities Index down -1.61%.  Energy -1.59%.  Base Metals +1.24%.  Agriculture -1.02%.  Gold -0.46%.


After 45 minute of trading this morning, XJO is up +0.67%.

27/6/23. Tuesday Evening Finspiration Report.

 XJO up moderately today, +0.56%.


Today's candle was a bullish engulfing candle.  That's encouraging - but - there's a lot of overhead resistance so it could be slow going from here on.

XPJ (Real Estate) +1.95% was the best performing sector today followed by XMJ (Materials) +1.16%.

Here's the XPJ chart:


That's a three-day bullish configuration on the chart.  Big down day, doji, big up day.  There seems to have been a massive change in investor sentiment.  The first Supertrend line has switched from bearish (blue) to bullish (yellow).

For the strong minded - that looks like a buy signal.  Note, however, that the Sector is still below the 200-Day MA.  Keep monitoring.


Monday, June 26, 2023

27/6/23. Tuesday Morning Finspiration Report.

 Overnight in the U.S.:  Dow flat, Nasdaq down.


Dow Jones -0.04%.  SP500 -0.45%.  Nasdaq -1.16%.  Mid Caps +0.78%.  Small Caps +0.61%.  Banks +0.64%.

SP500.


The trend remains to the down-side.  Chart is close to the 20-Day MA and horizontal support where the chart might return to the upside..  Watch.

Commodities.

Commodities Index flat +0.13%.  Energy +0.72%.  Base Metals -1.0%.  Agriculture -0.09%.  Gold +0.17%.

After 45 minutes of trading this morning, XJO up +0.45%.

Finspiration Australia. 14/11/23. Tues. Morning Report.

Mixed Results in New York.  Energy up. NAB ex-dividend today. Dow Jones +0.16%.  SP500 -0.08%.  Nasdaq -0.11%.  Small Caps -0.07%.  Banks -0...