Dow Up, Nasdaq Down, Mid and Small Caps going berserk.

Market is healthier than the major indices suggest.
Dow Up, Nasdaq Down, Mid and Small Caps going berserk.
Market is healthier than the major indices suggest.
XJO mugged by the RBA at 2.300 p.m. today. XJO finished down -1.2%.

Only one sector escaped the carnage - Utilities (XUJ) up +0.54%. I guess people won't be turning off their heaters as winter descends upon us. But Discretionary Spending will be cut back, again. XDJ (Discretionary) was the worst hit sector, down -2.16%.
Industrials (XNJ) was the next worst sector, down -1.56%. Does that suggest our national economy is headed for recession? Maybe.
Information Technology (XIJ) didn't fare too badly, only down -0.19%.
But Health Care (XHJ) was hit, down -1.39%. Do people spend less on Health Care in order to pay their mortgage. Probably.
Looking at the chart, however, it remains in a sideways movement, held up by the 200-Day MA and restrained by the 5-Day and 30-Day MAs.
While the XJO can hold above the 200-Day MA, there's room for a little optimism.
Not much coming out of Europe, STOXX600 down -0.11%.
American Futures are also docile, but leaning to the down side. DJ Futures -0.14%. SP500 Futures -0.09%. Nasdaq Futures -0.02%.
Commodities and stocks both pulled back last night.
U.S. Indices.

SP500

Commodities.

Discretionary and Staples sectors are the worst - probably fretting about the RBA's interest rate decision coming out at 2.30 p.m.
XJO up strongly today, +1%.

All indicators in the lower panels are in "buy" positions - so that's a big positive.
I'd expect the next significant move to be to the upside.
Despite all the hoo-ha about the U.S. Debt Ceiling in the media, not much movement occurred in the Oz market this week. But, the media got its action on Friday night when the Dow Jones rose +2.12%, US Mid Caps rose +3.27%, U.S. Small Caps +4.06%.
Oz market will almost certainly follow to the upside on Monday
Let's get into the details.
XJO Daily Chart.

The chart remains in a down-trend. On Wednesday and Thursday it hit the lower edge of the Standard Error Channel then bounced on Friday back above the 200-Day MA. That's encouraging for the bulls but the chart needs to close Monday's high (circled) and get above the 50-Day MA (blue dotted line).
Until we see a significant break of structure by setting up a higher high and higher low, we have to presume the down-trend remains in place.
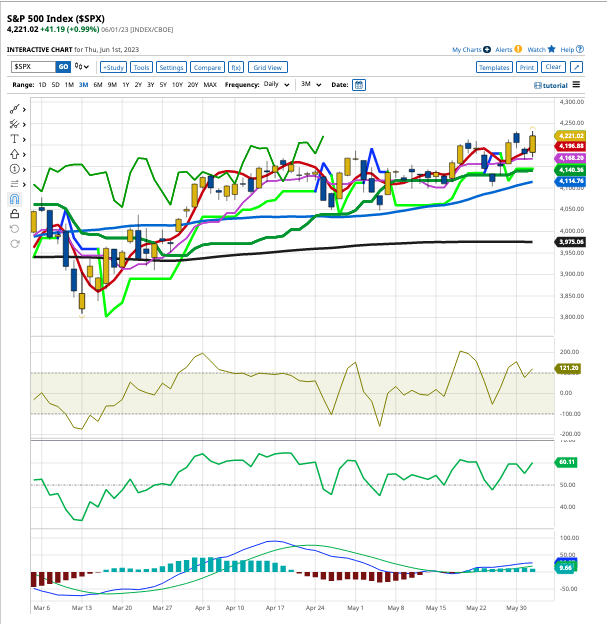
American SP500.
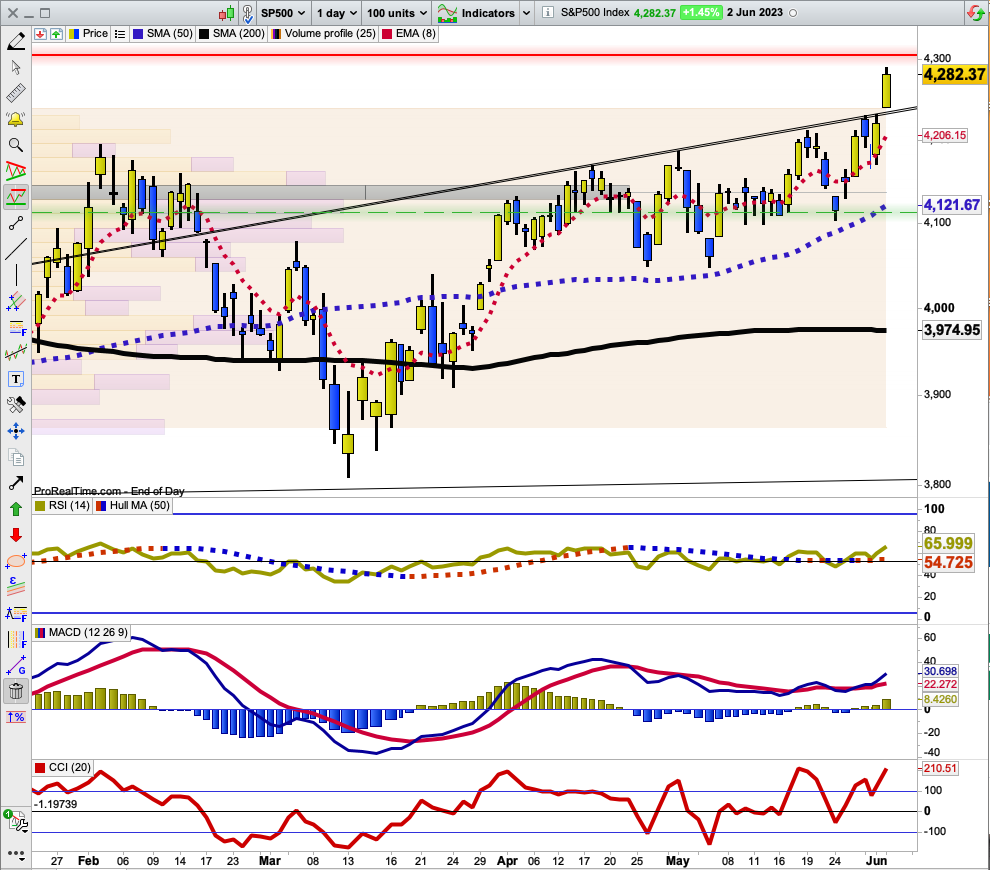
Just above the high of Friday is a major horizontal resistance level which was set back in August, 2022. That might cause the SP500 to stutter.
CCI shows a negative divergence suggesting we might see a pull-back in the near future.
Sector Performance this past week.


Sector Momentum.
A quick way to check momentum is to look at the difference between weekly and daily RSI. If daily RSI is below weekly RSI, then momentum is negative, or bearish. Vice versa, if daily RSI is above weekly RSI, then momentum is positive or bullish.

The above profile is indicative of a bearish market. Only two sectors are showing positive momentum, XIJ and XEJ. XXJ is flat, so it could be about to turn around from its current poor performance (see above).
Look to strong stocks in sectors with positive momentum.
Conclusion.
The Australian market has been in a down-trend since mid-April. That's in stark contrast to the American market, buoyed by rampaging tech stocks, has been in an up-trend since mid-March.
No doubt we will see a big upside move on Monday, but, until we see more sustained moves to the upside, doubts must remain about the Australian market.
XJO up moderately yesterday. Dow Jones - Whooshka.

Modest positive divergences on RSI and CCI suggest further upside.
Other than that - the chart remains bearish, and the current move is a counter-trend rely.
My opinion might change on Monday as a result of amazing conditions in the U.S. last night.
U.S. Indices.


Commodities.

Commodities Index +1.29%. Energy +2.35%. Base metals +0.5%. Agriculture +0.58%. Gold fell -1.47%.
Ozzie stocks in NY enjoyed a good night. BHP +4.13%. Rio +3.49%. Woodside +2.6%.
U.S. stocks rise strongly.

SP500.
Commodities.

With Stocks and Commodities up strongly, Australia is set for a strong Friday.
Mixed Results in New York. Energy up. NAB ex-dividend today. Dow Jones +0.16%. SP500 -0.08%. Nasdaq -0.11%. Small Caps -0.07%. Banks -0...


