Monday, April 17, 2023

Finspiration Australia

 18/4/23.  Tuesday Morning Finspiration Report.

Modest gains in the U.S. overnight.


Dow Jones +0.3%.  SP500 +0.33%.  Nasdaq +0.28%.  Mid Caps +0.76%.  Small Caps +0.59%.  Banks +1.4%.
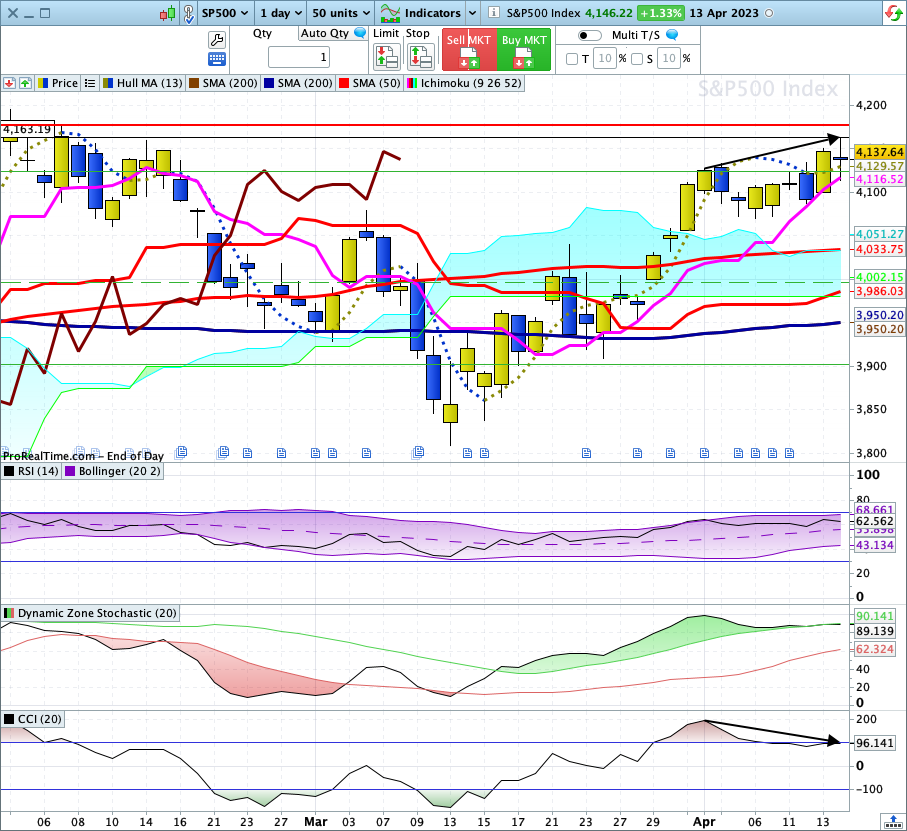
SP500.


The up-trend in the SP500 remains bullish.

DZ Stochastic continues to flirt with its "sell" line - last night it lifted just above the upper line of its Dynamic Zones.  RSI remains clear of its "sell" line - the 20-Day MA.  Both must confirm

Commodities.


Commodities Index -0.41%.  Energy -1%.  Base Metals -0.55%.  Agriculture +1.39%.  Gold -0.45%.

ASX Futures down -0.2% - that suggests the Oz market will have a weak opening.

Bitcoin.


Bitcoin was down heavily overnight, -2.88%.

Lots of bearish signals:
  • Three doji candlesticks in a row (lots of indecision) followed by a big bearish candle (indecision eradicated).  
  • Last night also fell below a major support/resistance line set back in May 2022.
  • The first Supertrend line has turned bearish.
  • Last night's candle fell below the 8-Day EMA.
  • RSI has fallen below its mid-line (20-Day MA).  That's a sell signal.
  • Dynamic Zone Stochastic has confirmed the RSI sell signal by falling below the upper line of the Dynamic Zones.
Stay Safe.


Finspiration Australia.

17/4/23.  Monday Evening Finspiration Report.

XJO up modestly today.  +0.27% 


XJO finished the day above horizontal resistance, but, with a narrow range day, it wasn't a particularly convincing performance today.

Everything on the chart remains bullish, except for a small negative divergence setting up on CCI.

The lack-lustre trading in Australia today seems to be carrying over to U.S. Futures.  Dow Jones up marginally +0.05%.  SP500 +0.09%.  Nasdaq -0.02%.


Sunday, April 16, 2023

      16/4/23.  Weekend Report - The Week That Was.  Week Ended 14/3523.

XJO Monthly Chart.


We've had two weeks so far in April.  XJO is up, so far, +2.56%.  Compared this month to lat month, the chart is looking bullish - too early, however, to decide.

The three Supertrend lines are showing a non-trending long term index, one Supertrend line above the chart and two Supertrend lines below the chart.  All three Suprertrend lines are horizontal - indicative of a sideways trend.

RSI is above 50 - bullish.

DZ Stochastic is above its buy line, but turned down just a little


XJO Weekly Chart.


The weekly chart shows the XJO in bullish mode, with all three Supertrend lines turning yellow.

DZ Stochastic is above its "buy" line.

RSI is above its centre line (20-Day MA), that's a "buy" signal.

Those two indicators confirm each other.


XJO Daily Chart.


XJO was up +1.98% this week.

XJO was up eleven of the past 13 days.  That's an unusually strong short-term rally, and it may be faltering at horizontal resistance.

DZ Stochastic and RSI remain in their bullish zones. 

Steady as she goes, Cap'n.  (Until it turns down.). Watch what happens at resistance.

SP500 Daily


Sp500 had a wide-range day on Friday, and failed at a minor Horizontal resistance level.

DZ Stock shows a negative divergence from the SPX Chart and has marginally broken below its "sell" line.

RSI remains above its 20-Day MA (its "sell" line" so it is not yet confirming the marginal "sell" signal  from DZ Stoch.  Any further downside and we will have a confirmed short-term "sell" signal on SPX.  That would invitably affect the XJO.

Weekly Changes in Sectors.


All sectors were up this week - breadth was good.  XMJ (Materials) had a return to form after losing ground the previous week.  XMJ up this week +4.08%.

XIJ was also up strongly, +2.55%.  Both are cyclical sectors.

The weakest sectors were both defensives, XHJ +0.3% and XUJ +0.12%

This is a picture of a strong market.

Sector Momentum.


All three columns sloping up - bullish trend.  XDJ, XIJ, XTJ, XHJ, XSJ, XPJ, XNJ, XGD/
All three columns sloping down - bearish trend.  Nil
Down then up - counter trend bullish rally.  XXJ, XEJ, XUJ.
Up then down - counter trend bearish rally.  No sectors. IAF (composite bonds)

All sectors show either bullish momentum or are in counter-trend bullish rallies.

NewHighs-NewLows.

This is a long-term indicator, but a good guide for long-term investors.


This week NH-NL Cumulative is back above both its 10-Day MA and its 21-Day MA.  That's a promising sign for long-term investors.

Stocks/Bonds Ratio.


Stocks/Bonds Ratio remains in a strong bullish rally.


% of Stocks above key moving averages.

1.  % of stocks above 10-Day Moving Average: Last Week 77%, This Week 81%.  
2.  % of stocks above 50-Day Moving Average, Last Week 51%, This Week 63%.  
3.  % of stocks above 200-Day Moving Average, Last Week 60%, This Week 67%.
4.  % of stocks above Hull MA13, Last week 76%, This Week 61%

All top three indicators have improved this week.  % of Stocks above 10-Day MA is getting a little overbought but the other two indicators are still far from being overbought.

Stocks positive on the Hull MA13 fell this week from 76% to 61%.  Hull MA13, despite its name, is a short-term indicator.  This means that a bit of a pull-back occurred late in the week.


Conclusion.
 
Everything is looking AOK for the Australian market.  What could go wrong.

That gives me a quaesy feeling in the pit of my stomach.  

I might still suffer from PTSD as a result of the massive fall in the markets back in October, 1987.  Yes - everything looked OK back then too - then we had the biggest one-day fall in history.

Is this the calm before the storm?  Is a flock of black swans lurking below the horizon.  European real estate to implode?  Escalation in the Ukraine/Russian War.

CNN has a "Fear and Greed" Index - which contrarians like to refer to.  It is currently in the "Greed" quadrant.  "Extreme Greed" usually occurs before a fall.

The FnG Index is a composite of seven indicators.  Currently, the following are showing "Extreme Greed:  

1.  SP500 and its 125 Day MA.
2.  Put/Call Options.
3.  Safe Haven Demand

Three out of the seven indicators are in Extreme Greed territory.  It wouldn't take much to switch the whole Index into Extreme Greed reading.

It never pays to become too complacent about the market.  Nor does it pay to jump like a startled rabbit at the any sign of a pull-back.  

Stay vigilant.


Friday, April 14, 2023

Finspiration Australia.

15/4/23.  Saturday Finspiration Report. 

XJO up on Friday.  Dow Jones down on Friday night.


XJO, after starting on the down-side on Friday, finished on the high-side, up +0.51%.  It remains stalled at horizontal resistance where it's been for the past three days.

The trend remains up - so stay with the trend until we see definite signs of a pull-back.

Overnight in America.

Dow Jones -0.42%.  SP500 -0.21%.  Nasdaq -0.36%.  Mid Caps -0.52%.  Small Caps -0.79%.  Banks +1.09%.

SP500.


Last night's candle was a "doji" indicating indecision.

SP500 is stalling at horizontal resistance and CCI is showing negative divergence.

DZ Stochastic has marginally broken below its upper Zone line - the first suggestion of a "sell" signal.  This needs confirmation by a move by RSI below its middle line - its 20-Day MA.

Commodities.


Not much movement in Commodities except for Gold.

Commodities Index +0.12%.  Energy +0.09%.  Base Metals +0.1%.  Agriculture +0.19%.  Gold -1.77%.

The Gold chart has left and "evening star" doji candle-stick from Thursday night.  That's often a sign of a pull-back.  But the chart has been left sitting on the 20-Day MA - so it could bounce here.

Overnight in the U.S., BHP was down -1.79% and Rio was down -1.89%.

Bitcoin.

Bitcoin in USD was up +0.63% last night and remains bullish.

(I don't have an up-to-date chart yet, but will put one up when it becomes availble.)


Thursday, April 13, 2023

Finspiration Australia.

 14/4/23.  Friday Morning Finspiration Report.

U.S. records another solid upside move.


Dow Jones +1.14%.  SP500 +1.33%.  Nasdaq +1.99%.  Mid Caps +0.69%.  Small Caps +0.84%.  Banks +0.73%.

SP500.


The SP500 remains in a strong upside rally, but the negative divergence on CCI suggests it may be on its last legs.

SP500 had a good run, but it might be too late to start buying into this rally now.  I'll be waiting on a pull-back.

Commodities.

Commodities Index +0.00%.  Energy -0.74%.  Base Metals +1.84%.  Agriculture -0.48%.  Gold +1.35&.

After 30 minutes of trading this morning, XJO is down marginally -.03%, it's never a good sign when the Oz market starts weak after a strong night on Wall Street.

Bitcoin.

Bitcoin continues on its merry (bullish) way, up last night +1.68%.  It has successfully tested major horizontal support/resistance.  I'd expect more upside.


Finspiration Australia.

 13/4/23.  Thursday Evening Finspiration Report.

Australian market was down modestly today.  XJO -0.27%.


Yesterday, XJO hit horizontal resistance and today retreated a little.  Today's candle is an "inside day", suggesting indecision.  Tomorrow's action could decide which way the market goes for the next few days.

Stochastic is showing a negative divergence from the chart, which suggests the next move will be to the downside.e

Only three sectors were up today, Energy +0.9%, Info.Tech. +1% and Property +0.4%.

The worst today, surprisingly, was Staples -1.2%.  That sector was in the overbought zone of the RSI so there might be some profit taking occurring in Staples.  Today's candle was a big bearish engulfing candle which suggests more downside in Staple.


Wednesday, April 12, 2023

Finspiration Australia

 13/4/23.  Thursday Morning Finspiration Report.

U.S. weakens overnight despite favourable inflation numbers for interest rates.


Dow Jones -0.11%.  SP500 -0.41%.  Nasdaq -0.85%.  Mid Caps -0.5%.  Small Caps -0.78%.  Banks -0.77%.

SP500.


Last night's candle is a bearish engulfing candle, but the Index remains within the confines of its sideways consolidation.  No real damage done yet.  

RSI and DZ Stock are turned down but still haven't given any "sell" signals.  Wait to see how this breaks from its consolidation.

Commodities.


Commodities Index +0.78%.  Energy +1.42%.  Base Metals +0.72%.  Agriculture _0.34%.  Gold +0.49%.

Resources stocks might save Australia from much damage today.

After an hour of trading this morning, XJO is down just -0.07%.

Finspiration Australia. 14/11/23. Tues. Morning Report.

Mixed Results in New York.  Energy up. NAB ex-dividend today. Dow Jones +0.16%.  SP500 -0.08%.  Nasdaq -0.11%.  Small Caps -0.07%.  Banks -0...