Thursday, March 9, 2023

Finspiration Australia.

 9/3/23.  Inspiration Thursday Evening Report.

XJO finished flat today after falling from highs around 3.00 p.m.


XJO finished up just +0.05% today.  The intra-day sell-off in the last hour is sometimes an indication that our market things the overnight results will be poor.  Today's doji candle-stick indicates indecision.

Today's action was weighed down by some big stocks going ex-dividend.  BHP fell -2.2%, Rio -2.9% and CSL -2.2%.

Myer was a screamer today, up +18.3% after giving out a good half-yearly report.

Some of the big banks did well today, ANZ +0.7%, WBC +1.2% and NAB +1.5%.  About a week ago I noted that the banks were exceedingly over-sold and to watch for a rebound.  That's coming good now.

Financials (XXJ) chart:


XXJ is back above its 8-Day EMA and Supertrend turned bullish back on Tuesday.  The trend is looking good in the short-term.

In early trading in Europe STOXX down -0.35%.

Dow Jones Futures showing -0.05%, while Nasdaq Futures are down -0.35%.


Wednesday, March 8, 2023

Finspiration Australia.

 8/3/23.  Finspiration Wednesday Evening Report.

From The Australian.


U.S. Markets down overnight - XJO followed down today.


XJO down today -0.77%, after J. Powell snatched away the punch-bowl just as we were getting ready to dive in.

Today's candle is a bearish engulfing candle pulling down from the 20Day MA and the 50Day MA.  Not a good look.

Trading has begun in Europe and, so far, Europe has avoided a knee-jerk reaction like Australia.  Euro STOXX600 down just -0.2%.  German DAX is up marginally, +0.04%.  Japanese Nikkei was up +0.4% today.

Only two sectors were up today, both defensives, Health +0.3% and Telecommunications +0.2%.

The worst performer was Energy -4.2%.  That was impacted by Woodside going ex-dividend.  WDS was down -7.2%.  

BHP was down -0.63% today in Australia.  In London after ninety minutes of trading this evening BHP is up +1%.  If that is an indication, our market should recover some ground tomorrow.


Tuesday, March 7, 2023

Finspiration Australia.

 8/3/23.  Finspiration Wednesday Morning Report.

Powell's comments sink U.S. Stocks.  Commodities down


Dow Jones -1.72%.  SP500 -1.53%.  Nasdaq -1.25%.  Small Caps  -1.0%.  Banks -3.87%.

SP500.


Selling was consistent throughout the session.  The three-day candle stick pattern is bearish after failing at the 20-Day MA.  

Last night's session broke below the 8-Day EMA and the 50-Day MA.

Support remains with the Supertrend.  Tonight's action looks crucial.

Commodities.


Commodities Index -2.05%.  Energy -2.8%.  Base Metals -2.46%.  Agriculture -0.15%.  Gold -1.75%.

After one hour of trading this morning, XJO is down -0.9%.  

Bitcoin.


Overnight, Bitcoin was down -1.59%.  It remains below the 50-Day MA and 8Day EMA.  Possible support zone is shown by the shaded rectangle.

Finspiration Australia.

 7/3/23.  Finspiration Tuesday Evening Report.

RBA announced its interest rate decision today, up +0.25%.  That may not be good news for home borrowers, but the stock market liked what it heard.  XJO up +0.49% today.  It was more or less flat when the RBA decision was announced.


I think Blind Freddy could see that this chart is looking bullish.  Today's candle finished above the 8-Day EMA and the 50-Day MA.  The Supertrend has switched from blue to yellow - bullish.

Barring nasty surprises from the U.S. tonight, we should see more upside in the near future.

Monday, March 6, 2023

Finspiration Australia

 7/3/23.  Finspiration Tuesday Morning Report.

A big day for Australian markets and home-owners today with the RBA interest rate decision scheduled for 2.30 p.m.

Overnight in America - mixed results after intra-day selling. Commodities down


Dow Jones +0.12%.  SP500 +0.07%.  Nasdaq -0.11%.  Small Caps down heavily -2.26%.  Banks -0.41%.

SP500.


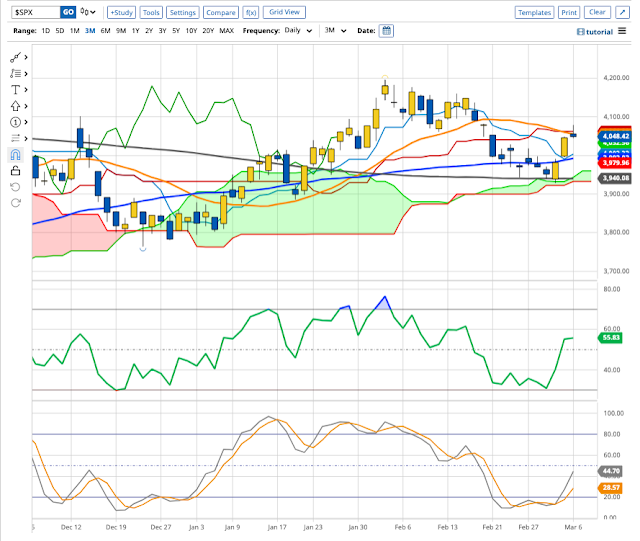
SP500 saw intra-day selling as it hit the Base Line of the Ichimoku system and the 20-Day Ma.  The next move either up or down could indicate the direction for the next few days.

Commodities.


Commodities Index -0.49%.  Energy -0.49%.  Base Metals -0.15%.  Agriculture -0.34%.  Gold -0.5%.

After nearly two hours of trading this morning, XJO is down a little -0.15%.  Waiting on the RBA.

Bitcoin.


Overnight, Bitcoin was up +0.73%.  It remains in a short-term down trend - looking to target the 50-Day MA and horizontal support.

Finspiration Australia.

6/3/23.  Finspiration Monday Evening Report. 

ASX today showed no fear about tomorrow's RBA Meeting.  XJO up +0.62%.  The market was held back today by falls in recent high fliers, Energy down -1.14%, Materials -0.25% and Utilities -0.47%.  Utilities often trails along behind Energy.

Best performing sectors today were Discretionary +1.95%,  Information Technology +1.77%, Property +1.7% and Financials +1.19.

Chart for XJO:


XJO finished above the 8-Day EMA today but now faces resistance from Supertrend (7/1.5) and the 20-Day MA - middle of the Bollinger Bands.  XJO might consolidate now for a day or two.

Chart for XXJ:


Today XXJ clawed its way back above the 200-Day MA.  It still has to rise above the 8-Day EMA and Supertrend.  But today's action coming off an extremely oversold RSI, suggests we'll see more upside.

Let's hope the RBA doesn't spring any surprises tomorrow.

Saturday, March 4, 2023

Finspiration Australia.

     5/3/23.  Weekend Report - The Week That Was.  Week Ended 3/3/23.

XJO Monthly Chart.


We've only had three days in March with the XJO up +0.35%.  In February, XJO was down -2.92%

So far, the Index is above the 8-MEMA, Hull MA13, 50-MMA, 200MMA, Supertrend (7/1.5).  Not much damage done yet.
  
Monthly RSI is at 54.31.  50 represents the dividing line between bullish and bearish.

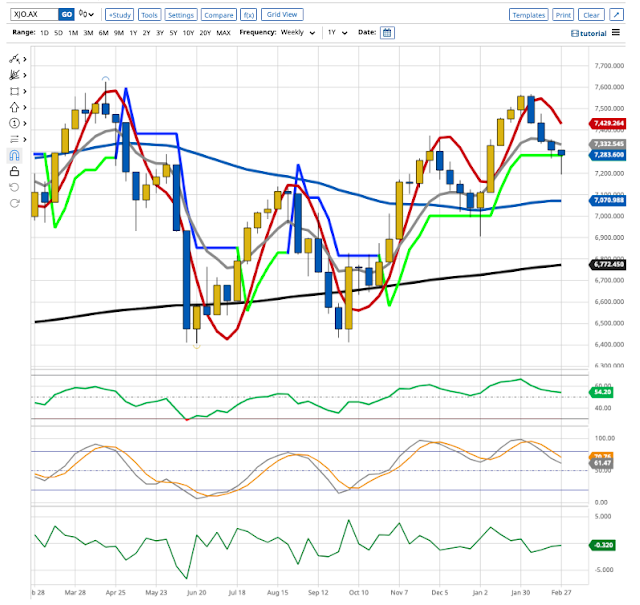
XJO Weekly Chart.


XJO remains in an up-trend, with higher highs and higher lows.  In the past five days, XJO fallen -0.32%.  The previous week it was down -0.54%.  So down side over the past two weeks has been modest.

This week saw good buying during the week to erase most of the early losses.

XJO began to fall four weeks ago at a major resistance level.  

8-Week EMA and Hull MA13 turned turned down, which is bearish. Supertrend continues to provide support this week.  Events overnight on Friday in America could see a break to the upside.   

Weekly RSI is at 54.2 - bullish but falling.  


XJO Daily Chart.


This week, XJO was behind the eight-ball with a big fall on Monday.  It has been up three of the past four days.

My shortest term moving average is the Hull MA13.  It turned down on the 9 Feb.  It has now turned up, so the down-trend could be ending.

I'd like to see the index finish above the 8-Day EMA (grey line) before feeling confident that the short-term trend has turned up.  That seems likely to occur on Monday, given events in the U.S. on Friday night.


Weekly Changes in Sectors.


Breadth was poor this week, with only two sectors pushing to the upside - but those two sectors did extremely well, Energy +5.19% and Materials +3.98%.

Financials, the biggest sector in the ASX, was down heavily -2.88%.  It has been doing very poorly in recent times, but could be coming to the end of its pull-back.


On the Thursday, XXJ fell heavily taking its RSI down to 26.6.  We rarely see the RSI for XXJ get below 30 before we get some sort of a rebound.  Watch XXJ on Monday for some good news for our market.

Gold Miners.

XGD (Gold Miners) was one of the stand-outs this week, up +6.42% after being down five weeks in a row.  The bullish engulfing candle for this week suggests more upside for the Gold Miners.  It has also bounced off support of the 50-Week MA - another bullish sign.


NewHighs-NewLows.

This is a long-term indicator, but a good guide for long-term investors.


NH-NL pulled to the upside this week, with the 3-Day MA rising sharply.  The 3-Day MA needs to get back above the 20-Day MA for long-term investors to feel comfortable about their investments.  Until that happens, stay defensive.

Stocks v Bonds.  Relative performance.


On a relative basis, Bonds are currently outperforming Stocks, i.e., the chart is below the zero level.

This is a reasonable picture of bullish and bearish status of the market.  It's probably a good idea for medium term investors to remain bearish on stocks while this chart remains below zero.  If you're a bit cheeky, you might go long if the chart rises above the 10-Day MA.


% of Stocks above key moving averages.

1.  % of stocks above 10-Day Moving Average: Last Week 44%, This Week 40%.  
2.  % of stocks above 50-Day Moving Average, Last Week 56%, This Week 55%.  
3.  % of stocks above 200-Day Moving Average, Last Week 65%, This Week 61%.

The longer term measures remain above the 50% mark.  So the market is not in bad shape.  Short-term I'd like to see Stocks above 10-DMA move back above 50%.

SP500.

I mentioned, early in this report, the good results in America on Friday.  Here's the SP500 chart.


The past two sessions on the SP500 have seen strong upside moves.    Friday saw a rise of +1.61%.  That triggered a number of bullish indicators.  

Thursday saw the SP500 bounce strongly off the 200-Day MA - that's a bullish indicator.  Friday saw the index cross above the 8-Day EMA, and the Supertrend changed from blue to yellow - bullish.  Hull MA13 has turned up - bullish.

This looks like the start of a good short-term upside rally.
 

Conclusion.
 
A lot of jig-saw pieces are falling into place for our market in the coming week.  SP500 has turned short-term bullish and we should follow suit on Monday.


Finspiration Australia. 14/11/23. Tues. Morning Report.

Mixed Results in New York.  Energy up. NAB ex-dividend today. Dow Jones +0.16%.  SP500 -0.08%.  Nasdaq -0.11%.  Small Caps -0.07%.  Banks -0...