Sunday, February 19, 2023

Finspiration Australia

    19/2/23.  Weekend Report - The Week That Was.  Week Ended 17/2/23.

XJO Monthly Chart.


After almost three weeks, XJO down so far -1.74% stalling at the top of the strong January candle.  XJO has also reached a zone where it has failed in the past.

So far, the Index is above the 8-MEMA, Hull MA13, 50-MMA, 200MMA, Supertrend (7/1.5).  Not much damage done yet.
  
Monthly RSI is at 55.26.  50 represents the dividing line between bullish and bearish.

XJO Weekly Chart.


XJO remains in an up-trend, with higher highs and higher lows.  In the past five days, XJO fallen -1.17%.

XJO began to fall two weeks ago at a major resistance level.  

8-Week EMA has turned down, which is bearish. Hull MA13 and Supertrend remain in bullish configurations, so not a lot of damage done yet.

Weekly RSI is at 56.87 - bullish but falling.  

Stochastic was showing a negative divergence and has now turned down below its signal line.  That could mean more downside.


XJO Daily Chart.


XJO was in a strong up-trend in January.  It is currently in a short-term down-trend.

Daily RSI has fallen below its mid-line of 50.  That's bearish

The indicator overlays on the chart (8-DEMA, Hull MA and Supertrend) are all negative.  The chart remains, however, above the longer term MAs:  50 and 200.  This may be a pull-back within the longer up-trend.


Monthly, Weekly and Daily RSIs. - Sectors + XJO + Gold + Composite Bonds.


This week's chart:


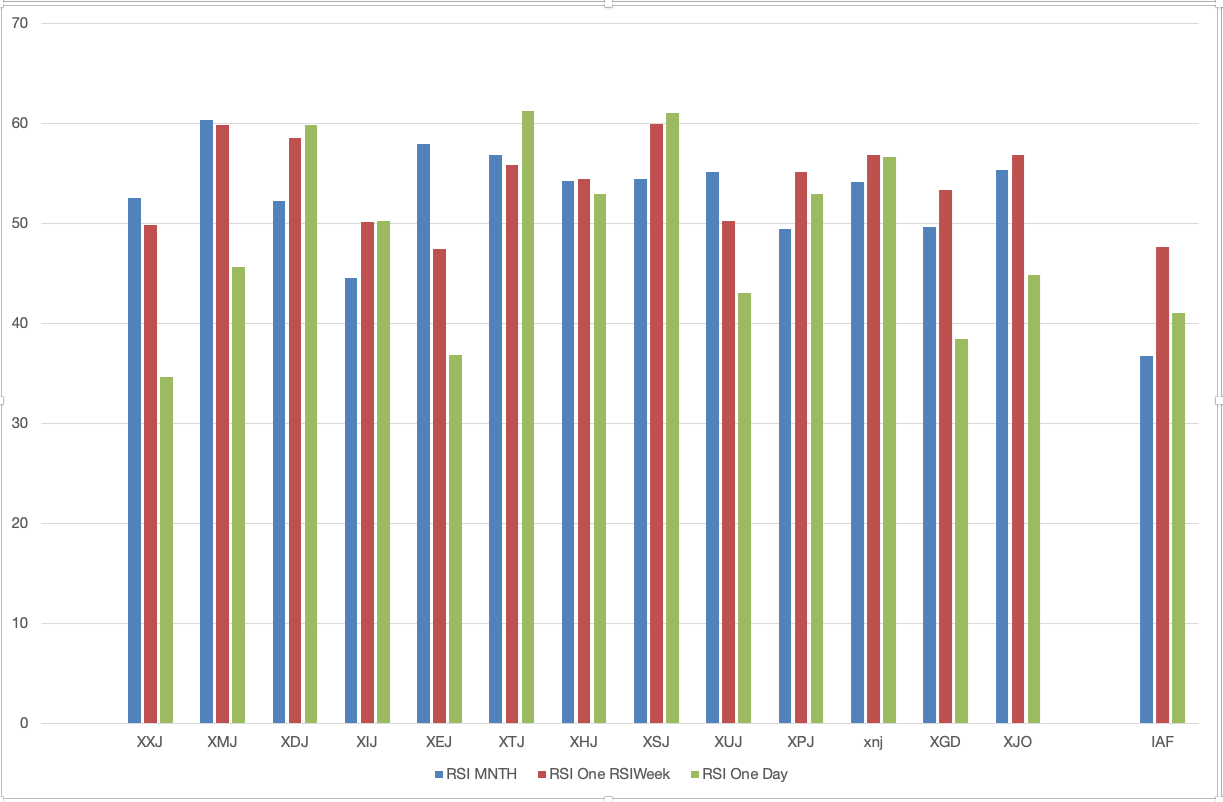
Only four sectors are above 50 on the One-Week RSIs.  

Bullish sectors with RSIs arranged in ascending order are:  XDJ, XIJ, XSJ.  That's the same as the previous week

Sectors in negative mode (Daily RSI below Weekly RSI, Weekly RSI below Monthly RSI) XXJ, XMJ, XEJ, XUJ.  That's eight out of eleven sectors.

Sectors in pull-back mode are:  XHJ, XPJ, XNJ, Gold (an industry group within XMJ) is alsoin pull-back mode. 


NewHighs-NewLows Cumulative.

This is a long-term lagging indicator, but a good guide for long-term investors.


NH-NL Cum is represented by the blue line.  It is now marginally below the 10-DAY MA but remains well above the 21 and 34 Day Moving Averages.  That's a warning signal - it might be time to take defensive action for long-term investors.

I've developed another long-term metric "StrongStocks-WeakStocks" which is similar to NH-NL but gives signals a little earlier than NH-NL  SS-WS is up for the 14th week in a row and has moved well above its 5-Week MA.   This week there were only 22 Strong Stocks compared to 6 the previous week.  Weak stocks rose to six.   

While this remains above its 5-Week MA, long-term investors might ignore the NH-NL chart.


% of Stocks above key moving averages.

1.  % of stocks above 10-Day Moving Average: Last Week 26%, This Week 42%.  
2.  % of stocks above 50-Day Moving Average, Last Week 61%, This Week 61%.  
3.  % of stocks above 200-Day Moving Average, Last Week 71%, This Week 70%.  


Stocks above 200-Day MA have fallen from 71% to 70% but remains at the 5-Week MA.
The short-term metric has risen strongly this week, so breadth is not as poor as the XJO might suggest.


Conclusion.
 
Daily chart of XJO was in a strong uptrend.  That has now now reversed into pull-back mode.

The long-term trend, however, is still bullish with higher highs and higher lows.

I've remarked on my daily reports that a "hidden divergence" is in play on the XJO.  That's a continuation signal.  We need to see a strong bullish candle on the daily chart to confirm a change from downside back to upside.

I'm still sanguine about the prospects of our market.  I think this is the pull-back we had to have (apologies to Keating) after a strong January.  A lot of stocks are getting back to levels where an upside move can be expected.  Short term breadth has improved. But, until proven otherwise, the short-term trend is down.


Finspiration Australia.

 18/2.23.  Finspiration Saturday Morning Report.

Yesterday, ASX down.  Overnight U.S. mixed.

XJO yesterday.


XJO down -0.86% yesterday.  It remains in a down-trend with the chart stuck in the lower half of the Bollinger Bands, below the 8-Day EMA and below the Supertrend Line.

The hidden divergence remains in play (higher low on the chart, but lower low on Stochastic).  That suggests that the Index will resume its primary up-trend.

For that to happen, we need to see a bullish candle on the chart and for RSI to close above its mid-line and for Accum/Distribution (lowest panel) to break above its MA.

Overnight in America.

Dow Jones +0.39%.  SP500 -0.28%.  Nasdaq -0.58%.  Small Caps +0.13%.  Banks +0.00%.

SP500.


SP500 finished in "No Man's Land", that's the narrow Bollinger Bands in the above chart.

Today's candle is a "dragonfly doji" - opening and closing at the same level.  That shows good intra-day buying.

The opening was a gap down from the previous day's candle.

A dragonfly doji, after a gap down, at the end of a down-trend, often suggests a weakening of the bears and a strengthening of the bulls.  That could signal an end to the down-trend.  A big up-day next is required to confirm.

Commodities.


Commodities Index -0.75%.  Energy -1.63%.  Base Metals +0.84%.  Agriculture +0.49%.  Gold +0.3%.

Gold shows a bullish engulfing candle coming at the end of a down-trend.  That could signal the end of the down-trend.

BITCOIN.


Thursday, February 16, 2023

Finspiration Australia.

 17/2/23.  Finspiration Friday morning report.

Overnight, U.S. stocks fall.  Commodities mixed.


Dow Jones -1.26%.  SP500 -1.38%.  Nasdaq -1.78%.  Small Caps -0.67%.  Banks -1.4%.

SP500.


SP500 is back to the 20-Day MA (black line in the middle of the Bollinger Bands).  It's found support several times before at that level, and probably will do so again this time.

The Index currently lies in "No Man's Land", that's the dark narrow BBs on the chart.

A strong up day off support would take it out of NML and above the 8-Day EMA.  That would be a "buy" signal.

Commodities.


Commodities Index -0.29%.  Energy -1.08%.  Base Metals +1.04%.  Agriculture +0.44%.  Gold flat -0.08%.

After 50 minutes of trading this morning, XJO is down about -0.5%.

Bitcoin.


BTC was up +1.4% overnight but showed selling during the evening session.  It has fallen further this morning back to test support.  The trend remains up.  Stay with the trend.


Finspiration Australia

16/2/23.  Finspiration Thursday Evening Report. 

XJO +0.79% up strongly today after yesterday's big down day.


Despite the strong performance today, the action counts as an "inside day" - not enough to call it a bullish event.

The chart remains below the 8-Day EMA.  We need to see a break, at least, above that short-term marker to feel comfortable that the down-trend is over.

Patience is a virtue, saith the Bard.

Wednesday, February 15, 2023

Finspiration Australia

  16/2/23.  Inspiration Thursday Morning Report.

Overnight:  US stocks opened lower but rose overnight after intra-day buying.  Commodities weak.


Dow Jones +0.11%.  SP500 +0.29%.  Nasdaq +0.92%.  Small Caps +0.98%.  Banks -0.02%.

SP500.


SP500 shows a hidden divergence (higher low on the Index, lower low on Stochastic).  That's a continuation pattern

The trend remains up - as the Trading Gods say:  "stay with the trend".

Commodities.


Commodities Index -1.07%.  Energy -0.96%.  Base Metals -1.95%.  Agriculture  -0.83%.  Gold -1%.

After nearly an hour so trading this morning, XJO is down about -0.6%.

Stocks featuring in Reporting Season Lottery  today:  CBA down -3.35%, Wesfarmers +2.69%, Cochlear +6.61%.

Iron Ore flat +0.1%.

ASX Futures up +0.5% - that should ensure a good start to morning trading.

Bitcoin.


Last night, BTC up nicely +8.6%.  Back now to resistance.  Expect some consolidation here before the next move to the upside.

Finspiration Australia.

15/2/23.  Finspiration Wednesday Evening Report.

XJO down today -1.06%.  The index is now into its eighth day since the closing high on  on 3 February.  Today's action was the biggest down day since the pull-back began.  That often results in a bounce on the next day.


The hidden divergence (higher low for the Index, lower low on Stochastic) is still in play.  I'd go long on the first big bullish candle.  We haven't seen one yet.

The index is now down to a level were a reversal looks possible.  The chart above shows an important horizontal support level, plus the index is down to support of the Kijun Sen (base line of the Ichimoku System).  Support from the 50-Day MA lies a little below the Kijun Sen.

Let's see what the overnight markets bring to the table.

Tuesday, February 14, 2023

Finspiration Australia.

 15/2/23.  Inspiration Tuesday Morning Report.

Overnight:  US stocks mixed after CPI report.


Dow Jones -0.46%.  SP500 -0.03%.  Nasdaq +0.57%.  Small Caps -0.35%.  Banks -0.2%.

SP500.


Last night's doji candle-stick represents indecision.  The closing price remains above the 8-Day EMA so the trend remains up.

The path of least resistance is to the upside, so SP500 will most likely move higher until major resistance is found.

Commodities.


Commodities Index +0.33%.  Energy +0.69%.  Base Metals +0.69%.  Agriculture continues to fly higher, +0.79%.  Gold +0.08%.

After nearly an hour so trading this morning, XJO is down about -0.6%.

Stocks featuring in Reporting Season Lottery  today:  CBA down -3.35%, Wesfarmers +2.69%, Cochlear +6.61%.

Bitcoin.


Last night, BTC up nicely +2.88%.  It has paused at the 8-Day EMA - it needs to cross above that to prove its short-term bullish credentials.


Finspiration Australia. 14/11/23. Tues. Morning Report.

Mixed Results in New York.  Energy up. NAB ex-dividend today. Dow Jones +0.16%.  SP500 -0.08%.  Nasdaq -0.11%.  Small Caps -0.07%.  Banks -0...