Monday, February 6, 2023

Finspiration Australia.

       8/2/2023.  Finspiration Wednesday Morning Report.

U.S. stocks up, Energy up, Base Metals up, Gold flat.

Dow Jones +0.78%.  SP500 +1.29%.  Nasdaq +1.9%.  Small Caps +0.69%.  Banks +1.27%.

SP500.


SP500 has bounced strongly off support of the 8-Day EMA..  Supertrend remains bullish.  The up-trend remains strong.  Stay with the trend.

Commodities.


Commodities Index +1.9%.  Energy +3.39%.  Base Metals +1.2%.  Agriculture +0.25%.  Gold +0.09%.

Overnight Oz Futures up +0.5%.  That should mean a good start to today's trading.

Bitcoin.


Bitcoin was up +1.24% overnight.

Bitcoin in USD continues to hang around its 200-Day MA in a sideways consolidation pattern.  Wait.


 6/2/23.  Finspiration Evening Report.

Bit of nothing day on the ASX today - waiting on the RBA tomorrow.


XJO finished down -0.25%.

Chart seems to be setting up for a pull-back with negative divergences on Stochastic and CCI.  We'll see tomorrow after RBA hands down its interest-rate decision.  Consensus is for +0.25%.

Big news today was for Newcrest after Newmont raised its take-over offer.  NCM up +9.3%.

Property (XPJ) has had a great run recently, down today -1.94%.  That's probably anticipating interest rates going up.

Currently, Europe is down, STOXX -0.59%.  New York Futures, SP500 -0.54%.  Not looking great for Oz tomorrow.  BHP in London is down -0.45% after being up today in Oz +0.61%.

See you all tomorrow.  Stay safe.

Saturday, February 4, 2023

  5/2/23.  Weekend Report - The Week That Was.  Week Ended 3/2/23.

This week saw further upside in the broad market.

XJO Monthly Chart.


We've only had three days so far in February.  XJO up so far +1.09% building on a strong January when XJO  up +6.22%.The Index is above the 10-MMA, Hull MA13, 50-MMA, 200MMA, Supertrend (7/1.5).  
Monthly RSI is at 58.19.  That's a bullish reading.

XJO Weekly Chart.


In the past five days, XJO risen +0.86%.  XJO Weekly is in an uptrend - higher highs and higher lows.

10-Week MA, Hull MA13 and Supertrend are all heading to the upside.

Weekly RSI is at 66.34.  That's above the Monthly RSI of 58.19, which indicates bullish XJO momentum.

Stochastic is showing a negative divergence which suggests we will see a pull-back.


XJO Daily Chart.


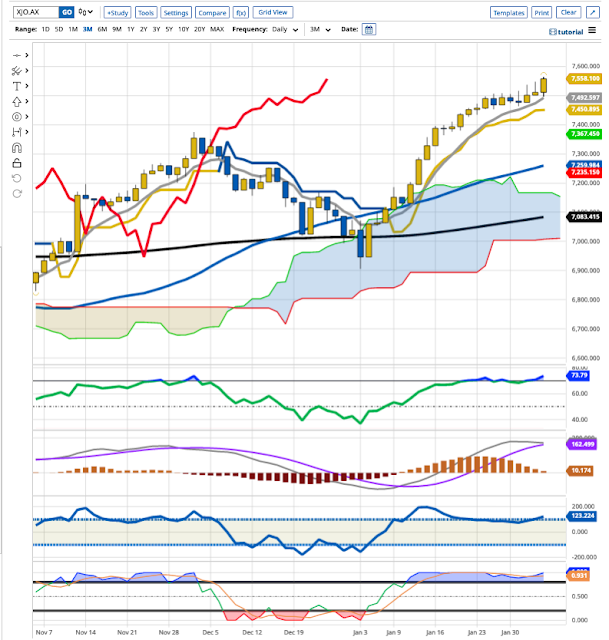
XJO has been in a strong up-trend since early January.  Daily RSI is now at 73.79 - that's overbought.  

The three Timed RSIs (monthly, weekly, daily) remain in ascending order. 58.19, 66.34, 73.79.  The chart remains bullish.

Stochastic is showing a negative divergence, confirming the negative divergence on the Weekly chart.  The future may not be as robust as the RSIs are currently suggesting.

Monthly, Weekly and Daily RSIs. - Sectors + XJO + Gold + Composite Bonds.


This week's chart:


Phwoar!!  Look at the number of overbought sectors on the daily columns (RSI >70).  Five sectors out of eleven are now >70, and XXJ is just a smidgin away with an RSI at 69.88.  We haven't seen anything like this for a long time.

Bullish sectors with RSIs arranged in ascending order are:  XDJ, XIJ, XTJ, XHJ, XSJ, XPJ, XNJ.

Bearish sectors with RSIs arranged in descending order are: XEJ, XUJ

Sectors in pull-back mode (Daily RSI falling below Weekly RSI) XMJ.

Sectors in Counter-trend rally mode (Daily RSI above Weekly RSI, WRSI below MRSI) XXJ.

Gold (an industry group within XMJ) is in pull-back mode. 

So, on the daily time-frame, eight out of eleven sectors are bullish.

XDJ is extremely overbought with a daily RSI at 80.  We don't often see that in a sector.

The big change this week was in XMJ - which is now in pull-back mode after being bullish the previous week.  That's important as it is the second largest sector in the ASX (after XXJ) and contains bell-wether stocks such as BHP and Rio Tinto.


NewHighs-NewLows Cumulative.

This is a long-term lagging indicator.


NH-NL Cum is represented by the blue line.  It is now above the 10/21/34 Day Moving Averages.  The Moving Averages are all aligned in bullish fashion from 10DMA at the top, then 21, then 31.  This provides a buffer against pull-backs.

I've developed another long-term metric "StrongStocks-WeakStocks" which is similar to NH-NL but gives signals a little earlier than NH-NL  SS-WS is up for the 12th week in a row and has moved well above its 5-Week MA.   This week there were 37 Strong Stocks and 4 Weak Stocks.   That's another confirmation of the current strength in the up-trend.


% of Stocks above key moving averages.

1.  % of stocks above 10-Day Moving Average: Last Week 70%, This Week 67%.  
2.  % of stocks above 50-Day Moving Average, Last Week 75%, This Week 78%.  
3.  % of stocks above 200-Day Moving Average, Last Week 69%, This Week 76%.  

Stocks above the 200-DMA are now nudging close to the 80% level - that's the overbought level.

Stocks above the 10-DMA are showing some weakness (short-term weakness).  


Conclusion.
 
XJO is in a strong uptrend.  Some structural weaknesses are beginning to show up with XMJ (Materials) in retreat, and Stocks above 10-DMA in retreat.

Negative divergences on Stochastics are forward looking and suggest we will see a pull-back in the near term.  We may see a test of the April, 2022 high before a pull-back.  XJO currently at 7558.  April, 2022 high was 7618 - just 60 points away.  That old high could be hit in just one day's trading.  (I'm not predicting that - just indicating how close the market is to that old high point.)

That high of 7618 has history for the XJO.  In round numbers, it was also the high back in Jan, 2022 and August, 2021.  A decisive break above 7618 would be tres bullish.

Our market probably deserves a well-earned rest after a strong performance since the beginning of the year.  At this stage, I believe that any pull-back is likely to be bought.  


Friday, February 3, 2023

Finspiration Australia.

       4/2/2023.  Finspiration Saturday Morning Report.

U.S. Friday's Job Report:  Unemployment rate in U.S. falls to lowest since 1969.

Friday Stocks:  Oz up, US down, UK all time high, Commodities down.  

Yesterday in Australia.


Yesterday, XJO surged higher +0.63%.  RSI is overbought at 73.9.  That's the highest level in more than twelve months.  That suggests we've seen a phase shift from bearish to bullish phases.   It would, however, seem to me to be unwise to be buying at this level.  It would also, however, be unwise to sell until we see definite signs of a pull-back.

Take a look at the chart below for XJO over the past twelve months.  Overlaid on the chart are two sets of Bollinger Bands, both with a mid-point of the 20-DMA but Standard Deviations of 1SD and 2SD:


Zone between +1SD and +2SD is a bullish zone.  Zone between -1SD and -2SD is a bearish zone.  Between +1SD and -1SD is No Man's Land.

XJO can stay in the bullish zone for long periods of time.  A "sell" signal is usually generated when (1) MACD Histogram falls below zero (it is almost there now) and, (2) the Index breaks below the mid-line of the Bollinger Bands (20-DMA).  (Unless, of course, you are a short-term trader where different conditions apply).  XJO is still well above the 20-DMA.   Wait.

In the U.S.


Dow Jones -0.38%.  SP500 -1.04%.  Nasdaq -1.59%.  Small Caps -0.38%.  Banks -0.3%.

SP500.


The long upper wick on the most recent candle indicates a volatile session, going higher than lower.  Plenty of intra-day selling.  The Jobs Report in the U.S. was very good - the market went up, then reconsidered (higher interest rates), then went down.

Commodities - smashed.


Commodities Index -2.52%.  Energy -3.23%.  Base Metals -2%.  Agriculture -0.55%.  Gold -2.5%.

BHP in NY -0.7%, Rio in NY -0.59%

None of this is looking good for the XJO on Monday.

Bitcoin.


Bitcoin was down -0.62% last night. It continues in it s consolidation pattern, floating around the 200-Day MA.

It is currently finding support of the Conversion Line of the Ichimoku System.  A break below that would probably see a test of the Base Line.  Wait.

Thursday, February 2, 2023

      3/2/2023.  Finspiration Friday Morning Report.

Dow Jones flat, Nasdaq up, Commodities down.

Dow Jones -0.11%.  SP500 +1.47%.  Nasdaq +3.26%.  Small Caps +2.38%.  Banks +1.15%.

Meta led the tech stock gains, up +23%.  

SP500.


Big gap up last night after Meta results.  Index is now close to overbought on the RSI, 69.14.  Stay with the trend, but expect a pull-back,

Commodities.


Commodities Index -0.74%.  Energy -1.08%.  Base Metals -1.47%.  Agriculture +0.4%.  Gold -2.08%.

XJO, after 20 mins of trading, is down -0.13%.

Bitcoin.


Bitcoin was down -0.65% last night. Last night's action is shown in the second candle from the right.  This looks like a failed break-out.  Watch for further selling overnight on Friday.

Finspiration Australia.

 2/2/23.  Finspiration Evening Report.

XJO up a little today after intra-day selling knocked the top off a good rally.

XJO finished up just +0.13%.

The past three days all show intra-day selling.  The long upper wicks on the past three candles all show that intra-day selling.

The bears are active in this market, but haven't yet been able to dominate.  No knowing if they will, but once they get to work they usually prevail.

Until we see clear evidence of a pull-back, stand with the up-trend.


Wednesday, February 1, 2023

FINSPIRATION AUSTRALIA.

     2/2/2023.  Finspiration Thursday Morning Report.

Dow Jones flat, Nasdaq up after Fed. interest rate announcement.

Dow Jones +0.02%.  SP500 +1.05%.  Nasdaq +2%.  Small Caps +1.49%.  Banks +0.56%.

SP500.


More upside after recent test of support.  Stay with the trend.

Commodities.


Commodities Index-1.89%.  Energy -3.4%.  Base Metals -0.73%.  Agriculture -0.69%.  Gold +1.26%.

XJO, after 90 mins of trading, is up +0.4%

Bitcoin.


Bitcoin was up >3% last night.  It moved back above the 200-DMA last night.  It continues to lie within its consolidation zone and remains above the 8-Day EMA and Supertrend.  Investor sentiment remains positive while it remains above those two indicators.  Watch for a definite move above the recent high for a break-out of the consolidation zone.

Finspiration Australia. 14/11/23. Tues. Morning Report.

Mixed Results in New York.  Energy up. NAB ex-dividend today. Dow Jones +0.16%.  SP500 -0.08%.  Nasdaq -0.11%.  Small Caps -0.07%.  Banks -0...