6/11/22. Sunday Report - The Week That Was. Week Ended 11/11/22,
XJO Monthly Chart.

This week, the chart has finished above the 8-Month Exponential Moving Average and above one of the Supertrend Lines. Another bullish sign.
If these gains can hold until the end of the month, we are entering a new bullish trend.
XJO Weekly Chart.

XJO had an exceptional week this week with the index up +3.58%. That's the third week in a row that it's been up, and momentum is increasing not decreasing.

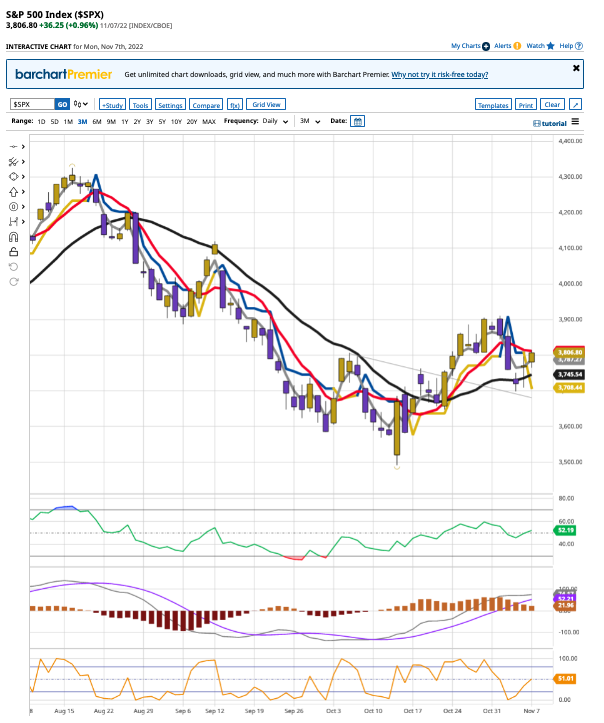
SP500 Weekly Chart

SP500 had a great week, up +5.9%. It remains below its 50-Day MA and lags the XJO in that regard. That's mainly because of the poor results in big tech stocks which have taken a caning in recent months.
Both Supertrend Lines are now bullish and Hull MA13 has turned up. Those are bullish events.
SP500 was up +0.92% on Friday after its big rise on Thursday of +5.54%.
SP500 weekly is in an uptrend - Higher High and Higher Low. Stay with the trend.
ASX Sector Results for this week.

Relative Strength of Sectors.
RSI (Relative Strength Index) is calculated using the default setting of 14 days - almost three weeks of trading. It provides a more reliable guide to changes in sectors than the one-week results which can jerk around quite a lot and, thus, RSI is probably a better guide to recent strength in the sectors. (Click here for a description of RSI.)

NewHighs-NewLows Cumulative.

This is a lagging indicator but bullish signals are usually highly reliable.
This is a metric for the long-term investor. While NH-NL Cumulative remains below its 10-Day Moving Average, it is best for long term investors to remain cautious and defensive regarding the market.
The gap between the NH-NL Cum and the 10-Day MA has narrowed down so a new bull signal may not be far off.