Friday, November 11, 2022

Finspiration Australia. Chart Analysis for Australian and International Stock Markets + Bitcoin.

 12/11/22.  Finspiration Morning Report.

Overnight stocks extend rally.  Commodities rise.  Bitcoin pulls back.

Dow Jones +0.1%.  SP500 +0.92%.  Nasdaq +1.88%.  Small Caps +0.56%.  Banks +1%.

SP500.


SP500 is in an up-trend from mid-October.  It seems headed for the 200-Day MA.  (DJ is already over that level.) 

We are now in a buy-the-dips scenario.  

Commodities.

Commodities Index +1.91%.  Energy +2.09%.  Base Metals +3.08%.  Agriculture +0.25%.  Gold +0.66%.

With both stocks on commodities on the rise, we should have another good day on the ASX on Monday.

Bitcoin.


Bitcoin fell back -5.84% overnight.  This remains a day-trader's market.  Long term investors might look elsewhere.


Stay Safe

Thursday, November 10, 2022

Finspiration Australia. Chart Analysis for Australian and International Stock Markets + Bitcoin

 11/11/22.  Finspiration Morning Report.

 - Whooshka!.  

Overnight in America  - Whooshka!.  


Dow Jones +3.7%.  SP500 +5.54%.  Nasdaq +7.35%.  Small Caps +5.9%.  Banks +5.75%.

Dow Jones.


DJ is now well clear of the 200-Day MA.  That's one criteria often taken of a bull market.

The Index may be forming a rising wedge - which is bearish.  We'll have to monitor that to see how it develops.

Commodities.


Commodities Index +0.9% - finding support at the 20-Day MA.  Energy +0.85%.  Base Metals +1.76%.  Agriculture +0.3%.  Gold +3.04%.

Overnight ASX Futures suggest that our market will open about +2% higher.

Bitcoin.


Along with other risk assets, Bitcoin had a great night, up >13%.  This is a great avenue for day traders. Big money to be made.

For the longer term, the future of Bitcoin remains dubious.  Plenty of overhead resistance to be overcome before it looks bullish again.

Wednesday, November 9, 2022

Finspiration Australia. Chart Analysis for Australian and International Stock Markets. + Bitcoin.

 10/11/22.  Morning Report.

American Indices keel over, Commodities weaken, ASX set to fall, Bitcoin smashed again.  (Doom and gloom).

Overnight in America:


Dow Jones -1.95%.  SP500 -2.08%.  Nasdaq -2.48%.  Small Caps -2.29%.  Banks -2.2%.

Dow Jones.


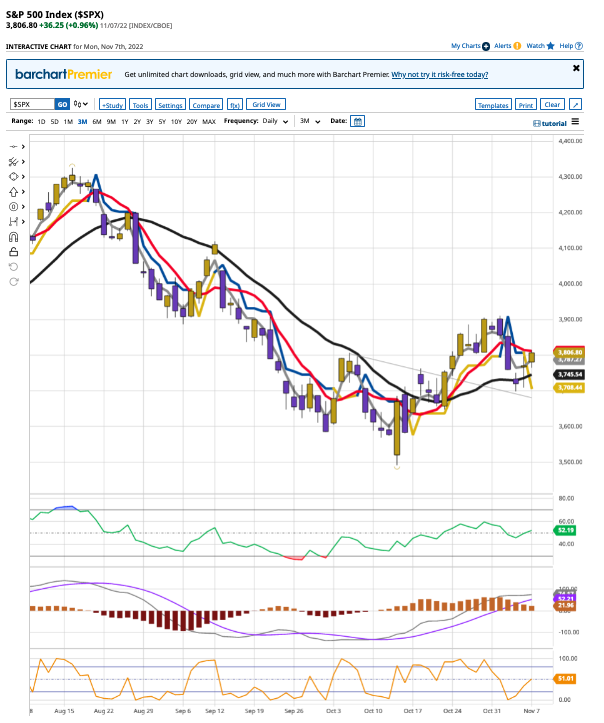
DJ has been the strongest of the major market indices in the U.S.  It has been the first to break above the 200-Day MA.  It has since been oscillating around that important dynamic support/resistance line.

Bollinger Bands are an interesting technical analysis tool.  One of the first things you learn about BBs is that a tag of the upper or lower bands is not, of itself, a buy or sell signal.  A chart can climb up an upper band or crawl down a lower band for considerable periods of time.  That effect is clearly seen in the above chart.  (See here for Bollinger on Bollinger Bands.)

An important pattern with BBs is the M Top.  That occurs when the chart closes outside the BBs, pulls back to a low, then closes higher but inside the BBs.  A break below the low is a sell signal.  In the above chart the low occurred on 3 November.  We'll watch carefully for a break below the low of 3 November.

Commodities.


Commodities Index -2.31$.  Energy -3.37%.  Base Metals -1.52%.  Agriculture -0.45%.  Gold -0.5%.

Iron Ore Futures -2.1%.

Overnight ASX Futures down -0.76%.

Bitcoin.


Bitcoin was smashed last night, down -15.9% in US$.  Avoid.


Tuesday, November 8, 2022

Finspiration Australia. Chart Analysis for Australian and International Stock Markets. + Bitcoin

 9/11/22.  Morning Report.

Overnight in America.  Stocks rise again.


Dow Jones +1.02%.  SP500 +0.56%.  Nasdaq +0.49%.  Small Caps +0.12%.  Banks +0.56%.

SP500.


SP500 is up for three days in a row and running into resistance of the Supertrend Line.

MAs 3/8/20/34 are all aligned in bullish fashion so there is plenty of nearby support.  I doubt the resistance of the Supertrend will hold up advance for too long.  

Commodities.


Commodities Index -1.21%.  Energy -2.37%.  Base Metals +1.28%.  Agrivculture -0.5%.  Gold +2.31%.

ASX should have another strong day today.

Bitcoin.


Bitcoin had a big fall last night down about -10% in USD.  It is back down into bear country.  Avoid.

Finspiration Australia. Chart Analysis for Australian and International Stock Markets

8/11/22.  Evening Report.

ASX 200 closed modestly higher today.  Up +0.36%


 XJO has had three days to the upside but is still overshadowed  by Thursday's big fall.

Until the Supertrend Line changes from blue to yellow, it is best to remain cautious,

The medium term trend is up - stay with that.

Stay Safe,

Monday, November 7, 2022

Finspiration Australia. Chart Analysis for Australian and International Stock Markets.

 8/11/22.  Morning Report.

Overnight in America, Stocks rise again.


Dow Jones +1.31%.  SP500 +0.96%.  Nasdaq +0.85%.  Small Caps +0.98%.  Banks +0.7%.

SP500.


After bouncing off the 20-Day MA, SP500 has given a new buy signal with the Supertrend Line switching from blue to yerllow and the Stochastic rising above 20.

Commodities.

Commodities settle back down after Friday's humungous rise.


Commodities Index -0.87%.  Energy -0.87%.  Base Metals -1.26%.  Agriculture +0.35%.  Gold -0.4%.

After 30 minutes of trading, ASX200 is up +0.15%.

Bitcoin.


Overnight, Bitcoin was down -2.38% and continued to fall a little in morning trade.

Supertrend remains bullish.  Stay with the up-trend.

Saturday, November 5, 2022

Finspiration Australia. Chart Analysis for Australian and International Stock Markets.

 6/11/22.  Weekly Wrap - Week ended 4/11/22.

XJO Monthly Chart.


XJO continues to hold at support of the 50-Month Moving Average.

It remains in a down-trend, below the 8-Month Exponential Moving Average and below both Supertrend Lines.  This down-trend started over a year ago.

The average bear market is 289 days - or about nine months.  We may be seeing a sustainable rebound - but after only one week in November, it is too early to say.

XJO Weekly Chart.


XJO had a good week this week with the index up +1.57% after being up  +1.63% the previous week.  The two Supertrend Lines on this chart are yellow, i.e., up-trending.

Hull MA13 is also indicating an up-trend.

These are medium term signals.

A move back above the 50-Week MA would be a bullish signal.

XJO Daily Chart.


XJO is locked between resistance of the 200-Day MA and horizontal support at about 6800 (round figures).

The 200-DMA has acted as support or resistance multiple times in the past year.  (The above chart only shows three months).

A decisive break above 200-DMA would be bullish.  That is often seen as the demarcation line between bull and bear.

Action in the U.S. may prove to be decisive on Monday.  Stock indices were up strongly, but Commodities went berserk.  Below is the Commodities Index chart showing the action.


Commodities Index Daily Chart


DBC was up +3.38% on Friday.   Friday's candle looks like a rocket launch into outer space.  In the previous three months, the best DBC could do was about +2.75% (three times). 

That should also launch our energy and mining stocks up higher.  

BHP was up +9.75% higher in the U.S. on Friday night.  Don't expect the same result in Australia on Monday - but it will be a lot higher than it closed on Friday.  

ASX Sector Results for this week.


It was a good week for the XJO with ten out of eleven sectors up.   The two resource sectors did well this week, Materials +2.64% and Energy +4.96%.  The only negative sector was Consumer Staples, down marginally -0.15%.  Property was up marginally +0.07%

Relative Strength of Sectors.

RSI (Relative Strength Index) is calculated using the default setting of 14 days - almost three weeks of trading.  It provides a more reliable guide to changes in sectors than the one-week results which can jerk around quite a lot and, thus, RSI is probably a better guide to recent strength in the sectors. (Click here for a description of RSI.)


Nine sectors out of eleven are above the 50 level - that represents a bullish result.  That's a dramatic improvement from tow weeks ago when only two sectors out of eleven were above 50.  Leadership is held by Energy (XEJ) Financials (XXJ).  Look to buy pull-backs in strong stocks in those two sectors.


NewHighs-NewLows Cumulative.


This is a lagging indicator but bullish signals are usually highly reliable.  

This is a metric for the long-term investor.  While NH-NL Cumulative remains below its 10-Day Moving Average, it is best for long term investors to remain cautious and defensive regarding the market.

% of Stocks above key moving averages.

1.  % of stocks above 10-Day Moving Average: Last Week 64%, This Week 59%.  
2.  % of stocks above 50-Day Moving Average, Last Week 43%, This Week 58%.  
3.  % of stocks above 200-Day Moving Average, Last Week 33%, This Week 35%.  

The two longer term measures (Nos. 2 & 3) both improved this week.  The slight weakness in No. 1 is due to the big sell-down on Thursday, but the overall picture is of an improving stock market breadth.


% of stocks above the 200-Day MA rose again this week.  Steady improvement can be seen in the bar chart and the 5-Week MA is rising.  

Conclusion.
 
Given the favourable stock and commodity rises in the U.S. on Friday night we should see a very strong day on the ASX on Monday.  Another test of the 200-Day MA is likely and a break above the 200-Day MA seems feasible in the coming week.

I'm expecting more upside in the near-term.


Stay Safe

Finspiration Australia. 14/11/23. Tues. Morning Report.

Mixed Results in New York.  Energy up. NAB ex-dividend today. Dow Jones +0.16%.  SP500 -0.08%.  Nasdaq -0.11%.  Small Caps -0.07%.  Banks -0...